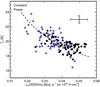
Fig. 9
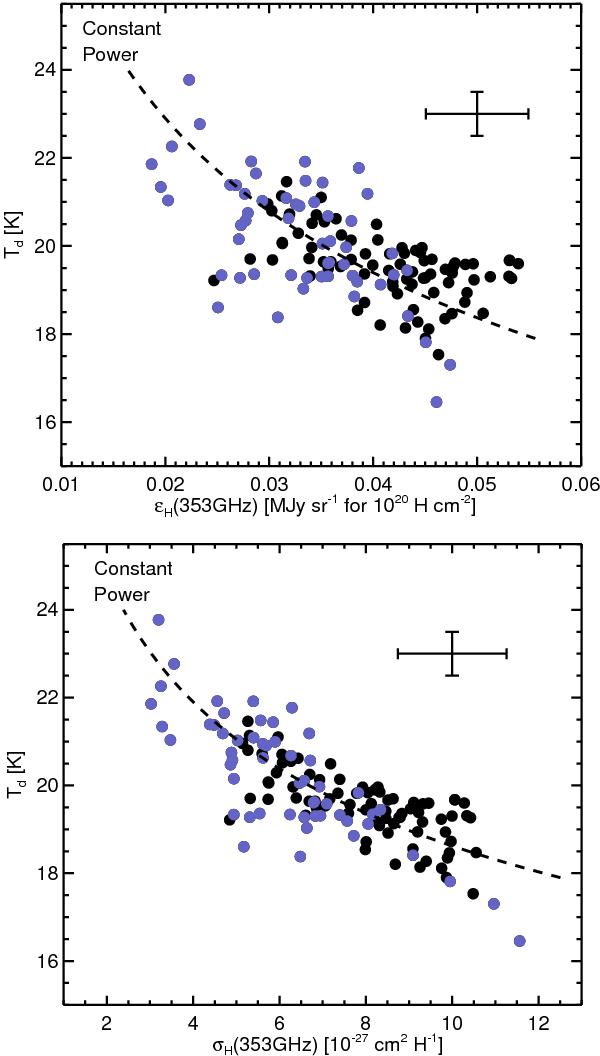
Top: dust colour temperature Td versus dust emissivity at 353 GHz, two independent observables (Fig. 3), with typical error bars at the top right. The dashed line represents the expected dependency of Td on the dust emissivity for a fixed emitted power of 3.4 × 10⁻³¹ W H-1. The blue dots identify data for sky patches centred at Galactic latitudes b ≤ −60°. Bottom: Td versus dust opacity at 353 GHz, re-expressing the same data in the form plotted by Planck Collaboration XXIV (2011) and Martin et al. (2012).
Current usage metrics show cumulative count of Article Views (full-text article views including HTML views, PDF and ePub downloads, according to the available data) and Abstracts Views on Vision4Press platform.
Data correspond to usage on the plateform after 2015. The current usage metrics is available 48-96 hours after online publication and is updated daily on week days.
Initial download of the metrics may take a while.