Fig. 8
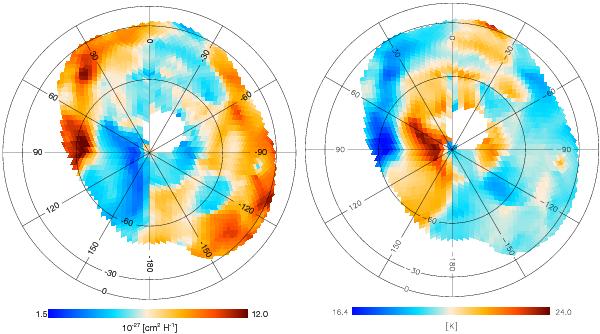
Left: map of the dust opacity σH(353 GHz) in Eq. (9). Right: colour temperature map inferred from the ratio between the dust emissivities at 100 μm from DIRBE and 857 GHz from Planck, with a spectral index of the dust emissivity βFIR = 1.65. This figure reveals that the temperature and submillimetre opacity of dust are anti-correlated.
Current usage metrics show cumulative count of Article Views (full-text article views including HTML views, PDF and ePub downloads, according to the available data) and Abstracts Views on Vision4Press platform.
Data correspond to usage on the plateform after 2015. The current usage metrics is available 48-96 hours after online publication and is updated daily on week days.
Initial download of the metrics may take a while.