Fig. 7
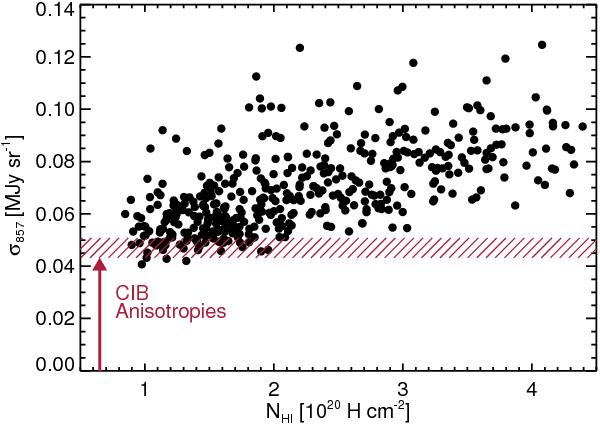
Standard deviation σ857 of the residuals with respect to the Planck-Hi correlation at 857 GHz versus the mean NHI, both computed within circular sky patches with 5° diameter and over unmasked pixels. The red hatched strip marks the contribution of CIB anisotropies to the residuals at 16′ resolution, computed from the CIB model in Planck Collaboration XXX (2014). The width of the strip represents the expected scatter (± 1σ) of this contribution. Both the scattered distribution of data points above CIB anisotropies strip and the increase in the mean σ857 with NHI arise from residuals with a Galactic origin (Appendix D).
Current usage metrics show cumulative count of Article Views (full-text article views including HTML views, PDF and ePub downloads, according to the available data) and Abstracts Views on Vision4Press platform.
Data correspond to usage on the plateform after 2015. The current usage metrics is available 48-96 hours after online publication and is updated daily on week days.
Initial download of the metrics may take a while.