Fig. 5
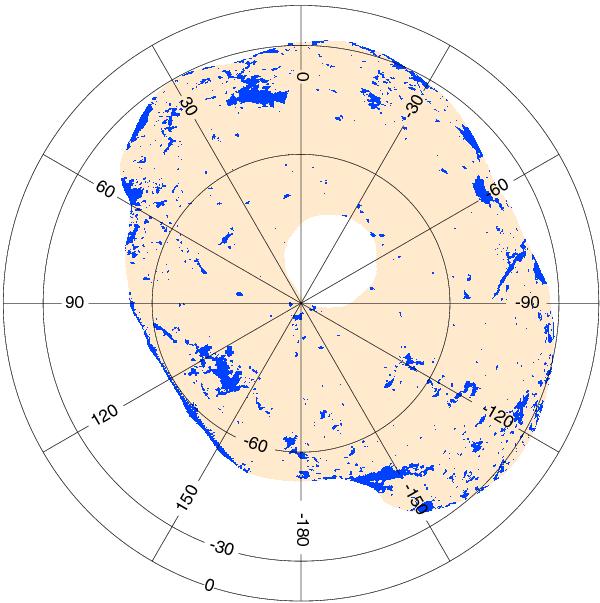
Mask for our analysis of the Planck-Hi correlation. The coloured area that is not blue defines the data used to compute the correlation measures. Within this area, the median NHI is 2.1 × 10²⁰ H cm-2, and NHI < 3 × 10²⁰ H cm-2 for 74% of the pixels. The blue patches correspond to regions where the absolute value of the residual emission is higher than 3σ at 857 GHz (Fig. 4). The circular hole near the Southern Galactic pole corresponds to the area where Hi gas in the Galaxy cannot be well separated because the mean radial velocity of the gas in the MS is within the Galactic range of velocities.
Current usage metrics show cumulative count of Article Views (full-text article views including HTML views, PDF and ePub downloads, according to the available data) and Abstracts Views on Vision4Press platform.
Data correspond to usage on the plateform after 2015. The current usage metrics is available 48-96 hours after online publication and is updated daily on week days.
Initial download of the metrics may take a while.