Fig. 4
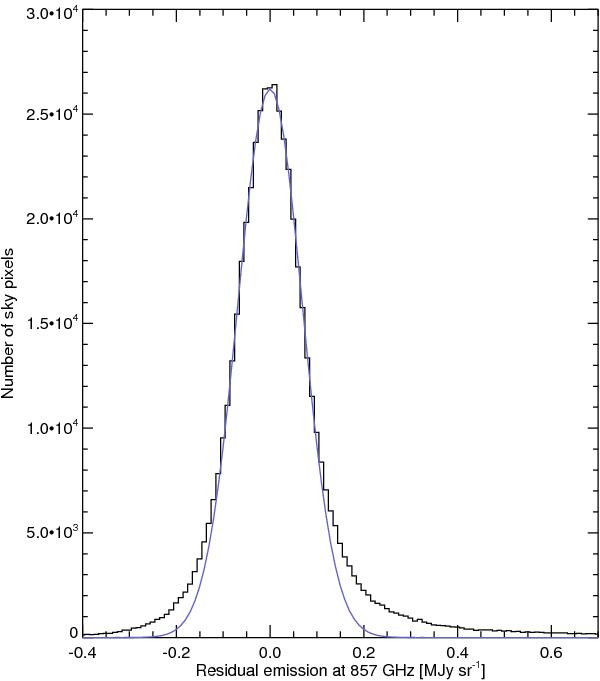
Histogram of residual emission at 857 GHz after subtraction of the dust emission associated with HI gas. The blue solid line is a Gaussian fit to the core of the histogram, with dispersion σ = 0.07 MJy sr-1. We mask pixels where the absolute value of the residual emission is higher than 3σ. The positve (negative) wing of the histogram beyond this threshold represents 7% (2%) of the data.
Current usage metrics show cumulative count of Article Views (full-text article views including HTML views, PDF and ePub downloads, according to the available data) and Abstracts Views on Vision4Press platform.
Data correspond to usage on the plateform after 2015. The current usage metrics is available 48-96 hours after online publication and is updated daily on week days.
Initial download of the metrics may take a while.