Fig. 3
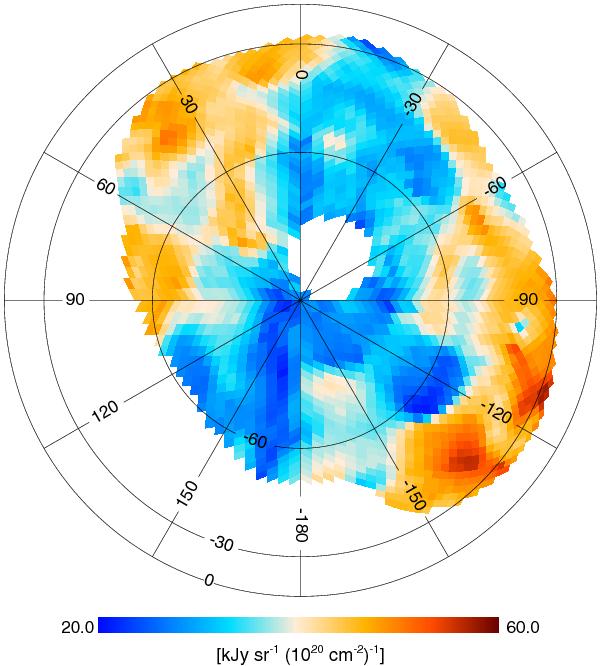
Map of the dust emissivity at 353 GHz, i.e. the correlation measure α353 with the CMB contribution α(CHI) subtracted (see Eq. (6)). The correlation measure is computed in each pixel correlating the Planck map with the Hi template over a sky patch with 15° diameter centred on it.
Current usage metrics show cumulative count of Article Views (full-text article views including HTML views, PDF and ePub downloads, according to the available data) and Abstracts Views on Vision4Press platform.
Data correspond to usage on the plateform after 2015. The current usage metrics is available 48-96 hours after online publication and is updated daily on week days.
Initial download of the metrics may take a while.