Fig. 16
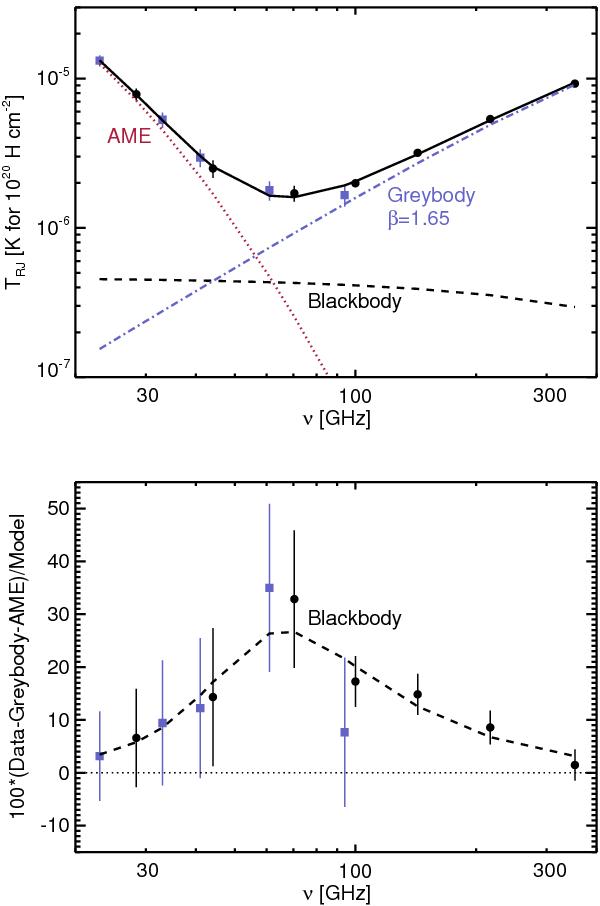
Top: same microwave dust SED as in Fig. 15 with the spectral fit for model 2 in Table 4. The spectral index of the greybody is fixed to the value βFIR = 1.65 inferred from the fit of the dust SED at ν ≥ 353 GHz (Table 3). The AME is fitted with the analytical model in Eq. (10). This fit includes a third component represented by a blackbody spectrum at the same temperature (19.8 K) as that of the greybody. Bottom: blackbody component in model 2 as a fractional residual after subtraction of the AME and greybody emission from the total, compared to the data residuals.
Current usage metrics show cumulative count of Article Views (full-text article views including HTML views, PDF and ePub downloads, according to the available data) and Abstracts Views on Vision4Press platform.
Data correspond to usage on the plateform after 2015. The current usage metrics is available 48-96 hours after online publication and is updated daily on week days.
Initial download of the metrics may take a while.