Fig. 15
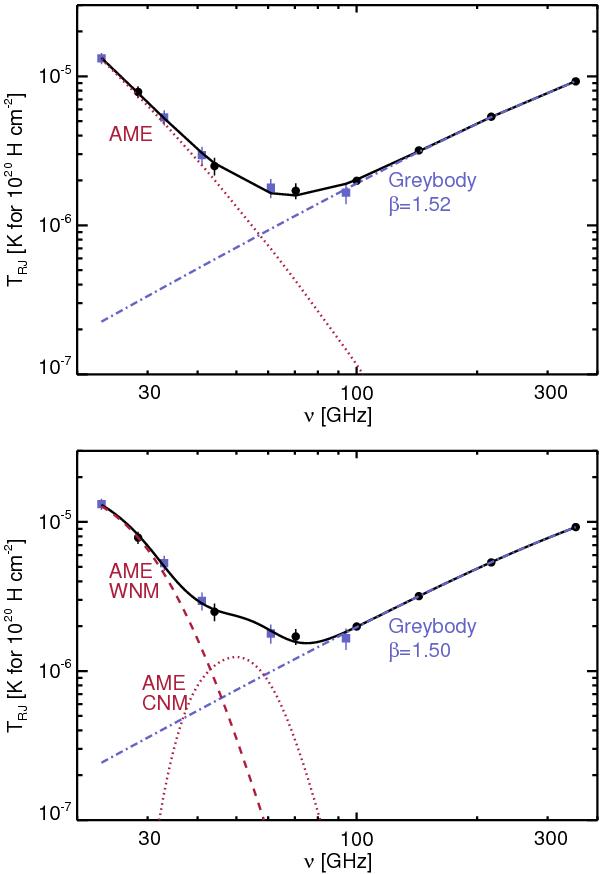
Mean microwave dust SED obtained by cross-correlating the Planck and WMAP data with the Hi and 408 MHz templates (blacks dots for Planck and blue squares for WMAP). Top: model 1 in Table 4, with two emission components combining AME and greybody thermal dust emission with β = 1.52. The AME is fitted with the analytical model in Eq. (10). Bottom: spectral fit for model 3, where the AME is fitted with two SPDUST spectra peaking at different frequencies.
Current usage metrics show cumulative count of Article Views (full-text article views including HTML views, PDF and ePub downloads, according to the available data) and Abstracts Views on Vision4Press platform.
Data correspond to usage on the plateform after 2015. The current usage metrics is available 48-96 hours after online publication and is updated daily on week days.
Initial download of the metrics may take a while.