Fig. 13
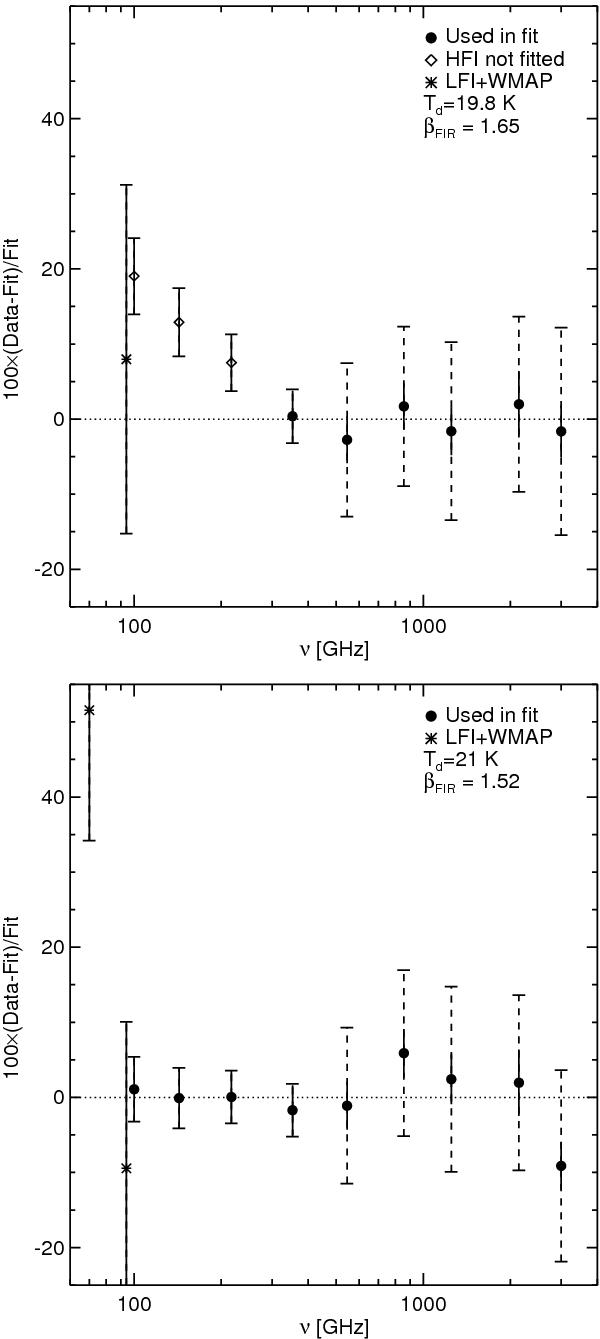
Top: residuals from a greybody fit of the mean dust SED at ν ≥ 353 GHz, using one spectral index. Dashed error bars are the quadratic sum of the statistical error (solid) and the photometric uncertainty. The photometric uncertainty is dominant at ν ≥ 545 GHz and negligible for the lower frequencies. Bottom: residuals from a greybody fit to all data points down to 100 GHz, again using a single spectral index.
Current usage metrics show cumulative count of Article Views (full-text article views including HTML views, PDF and ePub downloads, according to the available data) and Abstracts Views on Vision4Press platform.
Data correspond to usage on the plateform after 2015. The current usage metrics is available 48-96 hours after online publication and is updated daily on week days.
Initial download of the metrics may take a while.