Free Access
Fig. 10
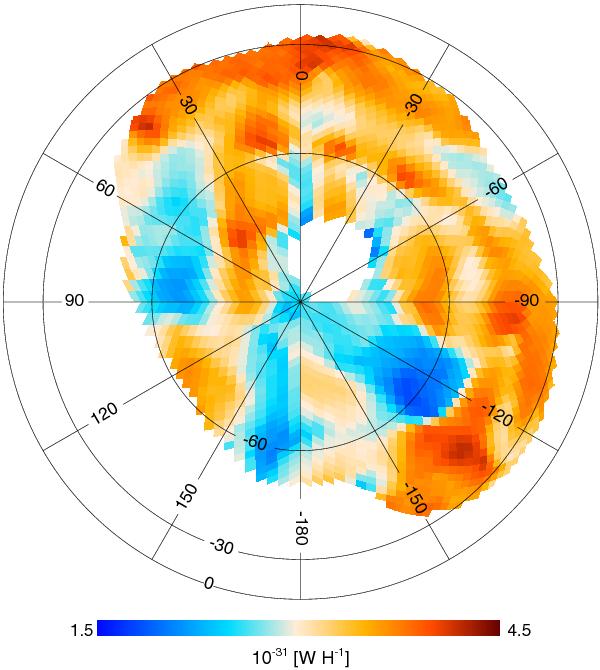
Map of the specific power radiated by dust at far infrared wavelengths per H. This figure displays spatial variations of the specific dust power, which may be decomposed as the sum of two parts correlated with the opacity and temperature maps (see Fig. 8), respectively.
Current usage metrics show cumulative count of Article Views (full-text article views including HTML views, PDF and ePub downloads, according to the available data) and Abstracts Views on Vision4Press platform.
Data correspond to usage on the plateform after 2015. The current usage metrics is available 48-96 hours after online publication and is updated daily on week days.
Initial download of the metrics may take a while.