Fig. 1
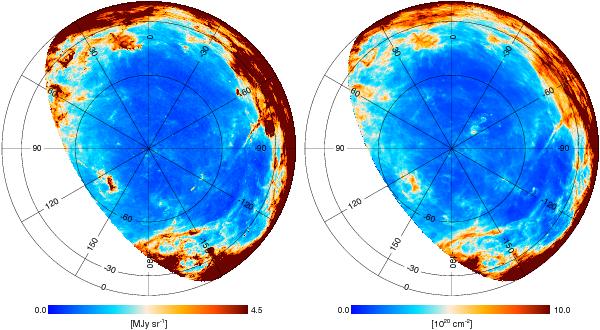
Left: Planck map at 857 GHz over the area where we have Hi data from the GASS survey. The center of the orthographic projection is the southern Galactic pole. Galactic longitudes and latitudes are marked by lines and circles, respectively. The Planck image has been smoothed to the 16′ resolution of the GASS NHI map. Right: GASS NHI map of Galactic disk emission, obtained by integrating over the velocity range defined by Galactic rotation (Sect. 2.2.2).
Current usage metrics show cumulative count of Article Views (full-text article views including HTML views, PDF and ePub downloads, according to the available data) and Abstracts Views on Vision4Press platform.
Data correspond to usage on the plateform after 2015. The current usage metrics is available 48-96 hours after online publication and is updated daily on week days.
Initial download of the metrics may take a while.