| Issue |
A&A
Volume 565, May 2014
|
|
|---|---|---|
| Article Number | A38 | |
| Number of page(s) | 10 | |
| Section | Stellar structure and evolution | |
| DOI | https://doi.org/10.1051/0004-6361/201323193 | |
| Published online | 30 April 2014 | |
LS 5039 – the counterpart of the unidentified MeV source GRO J1823-12⋆
1 Max-Planck-Institut für extraterrestrische Physik, Giessenbachstrasse, 85748 Garching, Germany
e-mail: wec@mpe.mpg.de
2 Key Laboratory for Particle Astrophysics, Institute of High Energy Physics, 100049 Beijing, PR China
Received: 4 December 2013
Accepted: 6 February 2014
Context. The COMPTEL experiment on CGRO observed the γ-ray sky at energies from 0.75 MeV to 30 MeV between April 1991 and June 2000. COMPTEL detected many γ-ray sources, among them an unidentified one labeled GRO J1823-12. It is located near l/b = 17.5°/−0.5° and positionally consistent with the prominent γ-ray binary LS 5039.
Aims. LS 5039 was established as a γ-ray source at TeV energies by HESS and at GeV energies by Fermi/LAT during recent years, whose γ-ray radiation is modulated along its binary orbit. Given this new information we reanalyzed the COMPTEL data of GRO J1823-12 including an orbital-resolved analysis.
Methods. We applied the standard methods, proper event selections and data binning with subsequent maximum-likelihood deconvolution, to analyze the COMPTEL data. In addition we developed a tool for selecting and binning the COMPTEL data in a phase-resolved manner. We present the orbit-averaged, as well as orbit-resolved MeV analyses, light curves, and spectra, and put them into a multifrequency context.
Results. The COMPTEL data show a significant MeV source, which is positionally consistent with LS 5039, but also with other closeby Fermi/LAT sources. The orbit-resolved analysis provides strong evidence, at about the 3σ level, that the MeV flux of GRO J1823-12 is modulated along the binary orbit of about 3.9 days of LS 5039. We show that at MeV energies, the source is brighter at the orbital part around the inferior conjunction than at the part of the superior conjunction, so it is in phase with X-rays and TeV γ-rays, but in anti-phase with GeV γ-rays. The high-energy spectral energy distribution (X-rays to TeV γ-rays) shows the high-energy emission maximum of LS 5039 at MeV energies.
Conclusions. We conclude that the COMPTEL source GRO J1823-12 is the counterpart of the microquasar LS 5039, at least for the majority of its MeV emission. The COMPTEL fluxes, put into multifrequency perspective, provide new constraints on the modeling of the high-energy emission pattern of the γ-ray binary LS 5039.
Key words: X-rays: binaries / X-rays: individuals: LS 5039/GRO J1823-12 / gamma rays: stars
Table 1 is available in electronic form at http://www.aanda.org
© ESO, 2014
1. Introduction
The Compton Gamma-Ray Observatory (CGRO) observed the universe in γ-ray energies with unprecedented sensitivity for more than nine years between its launch in April 1991 and its reentry into the earth atmosphere in June 2000. CGRO carried the four γ-ray experiments BATSE, OSSE, COMPTEL, and EGRET, which provided many new and exciting results in the regime of the γ-ray band, accesible only from space. In particular, many point sources between ~1 MeV and ~10 GeV were detected, surprisingly a big fraction remained unidentified until the end of the CGRO mission. For example, out of the 271 EGRET γ-ray sources listed in the 3rd EGRET source catalog for energies above 100 MeV, 171 remained unidentified (Hartman et al. 1999).
The COMPTEL experiment was sensitive to soft γ-rays (0.75−30 MeV) and finally opened the MeV-band, which was basically unexplored before CGRO, as a new astronomical window. Apart from γ-ray bursts and active galactic nuclei (AGN), the majority of the COMPTEL sources are unidentified objects. The first COMPTEL source catalog lists ten AGN and nine unidentified γ-ray sources (Schönfelder et al. 2000). One of these unidentified sources is GRO J1823-12, which is significantly visible in time-averaged COMPTEL maps of all standard energy bands between 1 and 30 MeV (e.g., Collmar et al. 2000a). GRO J1823-12 is located near l/b = 17.5°/−0.5°, spatially consistent with three EGRET γ-ray sources, the most prominent one being 3EG J1824-151 which was proposed as the counterpart of the microquasar LS 5039 (Paredes et al. 2000). Results of preliminary analyses of the COMPTEL data on GRO J1823-12 between 1991 and 1997 were reported by Strong et al. (2001) and Collmar (2003). The source showed a hard power-law spectrum with photon index of ~1.6 in the energy band between 1−30 MeV. However, the large error location area of the COMPTEL source meant that the source remained unidentified.
LS 5039 (Stephenson & Sanduleak 1971), a luminous star of the southern milky way (l/b = 16.88°/−1.29°), was first identified as a high-energy source by a cross-correlation with unidentified ROSAT X-ray sources (Motch et al. 1997). They suggested that LS 5039 is a high-mass X-ray binary system. The detection of LS 5039 by the High Energetic Spectroscopic System (HESS) at energies above 250 GeV (Aharonian et al. 2005) proved that LS 5039 is even a γ-ray source. The HESS measurements showed that the flux and the energy spectrum of LS 5039 is modulated with the orbital period of the binary system of ~3.9 days (Aharonian et al. 2006a). At present LS 5039 is well established as a high-energy source, e.g., at energies above 100 MeV by Fermi/LAT (Abdo et al. 2009; Hadasch et al. 2012), at hard X-rays (25−200 keV) by INTEGRAL (Hoffmann et al. 2009) and at X-ray energies (1−10 keV) by e.g., Suzaku (Takahashi et al. 2009). The microquasar is significantly detected at these energies, including the orbital modulation of its flux and energy spectrum.
Because this peculiar time variability of LS 5039 became known in past years and was detected in COMPTEL’s neighboring energy bands, we analyzed our COMPTEL data again on GRO J1823-12. The detection of such a time signature in the COMPTEL MeV data would (at least partly) identify this COMPTEL source as the counterpart of LS 5039. In this paper we report the analysis results and discuss them.
The paper is organized as follows: in Sect. 2 we briefly describe the COMPTEL instrument and the applied data analysis methods, the analyzed observations are summarized in Sect. 3. In Sect. 4 we present the analysis results and a high-energy spectral energy distribution (SED) in Sect. 5. In Sect. 6 we discuss our results and finally summarize and conclude in Sect. 7.
2. Instrument and data analysis
The imaging Compton Telescope COMPTEL was sensitive to γ-rays in the energy range 0.75−30 MeV with an energy-dependent energy and angular resolution of 5−8% (FWHM) and 1.7°−4.4° (FWHM), respectively. It had a large field of view of about one steradian and was able to detect γ-ray sources with a location accuracy of 1° − 2°, depending on source flux. For the details about COMPTEL, see Schönfelder et al. (1993).
COMPTEL contained two detector arrays in which an incident γ-ray photon is first Compton scattered in a detector of the upper detector array and – in the favorable case – then interacts with a detector of the lower detector array. The scattered photon direction (χ,ψ) is obtained from the interaction locations in the two detectors. The Compton scatter angle  is calculated from the measured energy deposits of the photon in the two detectors. These quantities, scatter direction and angle, constitute a three-dimensional data space in which the spatial response of the instrument is cone-shaped and standard imaging methods; e.g., maximum entropy and maximum likelihood, are applied. In the COMPTEL data analysis package, the maximum-likelihood method is used to estimate source parameters such as detection significances, fluxes, and flux errors. The detection significance is calculated from the quantity −2ln λ, where λ is the ratio of the likelihood L0 (background) and the likelihood L1 (source + background). The quantity −2ln λ has a
  distribution (3 degrees of freedom) for an unknown source and a
  distribution for a known source (de Boer et al. 1992). The instrumental COMPTEL background was modeled by the standard filter technique in data space (Bloemen et al. 1994).
To account for any diffuse astrophysical background in the data, the COMPTEL software provides three diffuse all-sky emission models, which can also be fit additionally to the data by a single scaling factor each. An uniform isotrop model represents the extragalactic γ-ray background. Two models are available to account for the emission of the galaxy. One model represents the galactic inverse-Compton emission, while the other the galactic bremsstrahlung emission via galactic density profiles of HI and CO.
Owing the location of GRO J1823-12 at low galactic-latitudes in the inner galaxy (l/b =~17.5°/−0.5°), we included all three diffuse emission models in the source analysis. The scaling factor of the extragalactic γ-ray background was fixed to the fluxes calculated from the diffuse extragalactic MeV-spectrum as derived by Weidenspointner et al. (1999). To account for the specific environment of the analyzed sky regions, the scaling factors for the two galactic diffuse emission models were allowed to vary freely. However, we checked these scaling factors numerically after the fitting procedure in order to avoid unreasonable or unphysical values that might lead to unrealistic source fluxes. In addition, we added known nearby COMPTEL point sources in the fitting process, so the scaling parameters of the diffuse galactic emission models, as well as the point-source fluxes were estimated by simultaneous fitting.
Because in sky maps the location of the microquasar LS 5039 was always close to the maximum of the likelihood distribution, we assumed a point source at the LS 5039 location for the flux estimates. The most important additional source is the “nearby” quasar PKS 1830-210 at l/b =~12.2°/−5.7°, which is also a known COMPTEL source (e.g., Zhang et al. 2008). The inclusion of two more MeV sources, one at the Galactic center, the other one being the COMPTEL detected blazar PKS 1622-297 (Zhang et al. 2002) showed no influence on the derived source fluxes of GRO J1823-12.
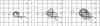 |
Fig. 1 COMPTEL 1−3 (left), 3−10 (middle) and 10−30 MeV (right) maps, generated in galactic coordinates (l,b), show the statistical evidence of GRO J1823-12 for the sum of all data. The contour lines start at a detection significance of 3σ (1 d.o.f. for a known source) with a step of 0.5σ. The location of the microquasar LS 5039 (diamond, l/b: 16.88°/−1.29°) and the lensed quasar PKS 1830-210 (square) are indicated; i.e., the locations of the simultaneously fitted COMPTEL sources. The quasar PKS 1622-297 and a possible source at the Galactic center, both out of the plot region, were also taken into account in the simultaneous fitting. The 10−30 MeV band yields the highest detection significance (7.8σ) at the position of LS 5039. |
We analyzed the data in three of the four so-called “standard” COMPTEL energy bands (0.75−1, 1−3, 3−10, and 10−30 MeV). We omitted the lowest COMPTEL band (0.75−1 MeV) because the systematics in this narrow COMPTEL band (small effective area) at the lower edge of the COMPTEL energy range are large and not well understood.
To estimate the flux of sources in the three bands, we applied instrumental point spread functions assuming an E-2 power-law shape for the source input spectrum in the different energy bands. We note that the derived fluxes weakly depend on this particular shape; i.e., the flux changes by applying say e.g., an E-1.6 power-law shape PSFs were always significantly smaller than the 1σ errors on the estimated source fluxes by application of an E-2 power-law PSF.
The goal of the analyses was to derive the MeV-properties of the unidentfied COMPTEL source near l/b =~17.5°/−0.5°. Therefore we selected all useful COMPTEL observations within a pointing direction of 35° to this sky position (see Sect. 3). We analyzed these data in time periods of at least one year. The systematic uncertainties on the diffuse emission models make flux estimates for individual pointings to this sky region, i.e., one to two weeks, unreliable. In fact, we present quantitative spectral results only for longer time periods, in particular for the sum of all data, i.e., for the complete mission, thereby using the maximum available statistics.
We like to note that we checked our analysis results by analysing the data also for different data selections. By analysing selected subperiods in time and analysing the data in revised energy bands, we yield consistent results for flux levels and source significances. This shows that the results in this paper are independent of the applied analysis mode or the selected observational period.
3. Observations
During the complete CGRO mission from April 1991 to June 2000, GRO J1823-12 was in 51 observational periods, so-called CGRO viewing periods (VPs), within 35° of the COMPTEL pointing direction. Each VP lasts typically for one to two weeks. Table 1 provides the basic informations on these 51 VPs and groups them within the nine longterm observational periods of CGRO, so-called phases or cycles. A CGRO phase or cycle covers a time period of roughly one year. The CGRO mission was subdivided into four mission phases, of which the last one consists of six (4 to 9) cycles. COMPTEL observations on the GRO J1823-12 region are available up to the last cycle, i.e., up to early 2000. These 51 VPs add up to a total effective exposure – COMPTEL pointing directly and uninterruptedly at the source – of ~81 days. We analyzed the sum of these 51 VPs and present the results in Sect. 4 of this paper.
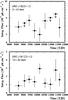 |
Fig. 2 COMPTEL light curves of GRO J1823-12, fitted at the sky location of LS 5039, in the 3−10 and 10−30 MeV bands. The flux points (integral photon fluxes for the given bandwidth) are averaged over individual CGRO phases or cycles, each covering roughly one year. For the details on the observations see Table 1. |
4. Results
First, we present the results of an orbit-averaged (time-averaged) analysis of the COMPTEL data of GRO J1823-12. These analyses provided some MeV properties of this γ-ray source, which – in a next step – are compared to published properties of the Fermi/LAT sources of this sky region. Second, we show the results of an orbit-resolved analysis, where we checked whether the MeV emission of GRO J1823-12 is modulated with the orbital period of the LS 5039 binary system.
4.1. Orbit-averaged analyses
4.1.1. Source detections
In a first step we generated circular skymaps around the estimated sky position of GRO J1823-12 (l/b:17.5°/−0.5°) by applying the described analysis methods and data selections (see Sects. 2 and 3). These maps with radius of 40° and a sky binning of 1° were cross-checked for MeV sources. The central part of the three maps for the sum of all 51 VPs, i.e., complete mission with an effective COMPTEL exposure of ~81 days (see Table 1), are shown in Fig. 1. Each map, derived for the COMPTEL standard energy bands 1−3 MeV, 3−10 MeV, and 10−30 MeV, shows a significant source, which is consistent with the location of the microquasar LS 5039. The most significant sky pixel either contains the location of the microquasar (3−10 MeV, −2ln λ: 37.0) or is one pixel apart (1−3 MeV, −2ln λ: 24.3; 10−30 MeV, −2ln λ: 63.9).
4.1.2. Time variability
We investigated the time variability of the MeV-flux on timescales of CGRO phases, i.e., on time periods of about 1 year. Figure 2 shows the fluxes along the COMPTEL mission in the two uppermost (3−10 and 10−30 MeV) COMPTEL bands for the sum of VPs of individual CGRO phases (see Table 1). We show these two bands, because the background changes (e.g., depending on orbital altitude) along the mission are small; in particular, the 10−30 MeV band is unaffected, which makes these high-energy bands more reliable than the lower-energy ones. Also, in these bands GRO J1823-12 is more significantly detected in time-averaged analyses. We plot a flux point if the source reaches at least a 1σ-detection level. If not, we plot a 2σ upper limit.
The 3−10 MeV light curve is less conlusive. Detections, although on a low significance level, and non-detections occur along the mission, adding up to a ~6σ-detection for the sum of all data. The 10−30 MeV light curve, however, shows always evidence (at least 1σ) of the source with some hints for time variability. During CGRO Phase IV/Cycle 5, the flux is more than three times higher than during the observations in CGRO Phase I. However, a quantitative analysis by assuming a constant flux results in a low and insignificant probability of 0.60 for a time variable flux. At these highest COMPTEL energies, GRO J1823-12 seems to be a steady MeV-emitter. This agrees with the observations at GeV- and TeV-energies, where the longterm light curves over years are also consistent with a steady source (e.g., Hadasch et al. 2012; Aharonian et al. 2006a).
4.1.3. Energy spectra
To derive the COMPTEL fluxes of GRO J1823-12, we applied the standard maximum-likelihood method as described in Sect. 2. Background-subtracted and deconvolved source fluxes in three standard energy bands were derived by simultaneous fitting of four γ-ray sources, two diffuse models representing the galactic emission, and an isotropic component describing the extragalactic diffuse emission. Since there is no obvious time variability, we concentrate on the most significant time-averaged data, the sum of all data (i.e., all VPs listed in Table 1). Table 2 gives the corresponding MeV fluxes of GRO J1823-12, assumed to be the microquasar LS 5039, in three bands. The corresponding spectrum including the best-fit power-law shape is shown in Fig. 3. In an E2 × differential flux respresentation, the fluxes rise towards higher energies. We fit a simple power-law model,  (1)where the parameter α is the photon index, and I0 the differential flux at the normalization energy E0, which was set to 5 MeV throughout all our analyses. We find a well-fitting hard power-law shape with a photon index on the order of ~1.6. (Table 3).
Fluxes, assuming a source at the location of LS 5039 for the sum of all data (VPs 5.0–907.0).
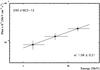 |
Fig. 3 COMPTEL energy spectrum of GRO J1823-12, fitted at the location of LS 5039, in an E2 × differential flux representation for the sum of all data. The fluxes are derived in the 3 standard COMPTEL energy bands (1−3, 3−10, 10−30 MeV). The error bars are 1σ. The solid line represents the best-fitting power-law shape between 1 and 30 MeV. |
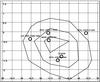 |
Fig. 4 COMPTEL error location contours for the most significant COMPTEL detection of GRO J1823-12, obtained in the 10−30 MeV band for the sum of all data. The contour lines are plotted on a map in galactic coordinates (l,b) of the LS 5039-region. The error contours start with 1σ in steps of 1σ. The sky positions (circles) of all γ-ray sources, listed in the second Fermi catalog and are within a search radius of 2° around the pixel center of the best-fit source location (l/b:17.5°/−0.5°) are shown. |
4.1.4. Fermi sources in the GRO J1823-12 field
Figure 4 shows the error location contours (1, 2, and 3σ) around the most significant COMPTEL detection, the 10−30 MeV band for the sum of all data. There are five Fermi-detected γ-ray sources located within the 3σ-confidence contour. LS 5039 is located in the sky pixel next to maximum. The source identification is not obvious, so we need other means to decide on the counterpart of the COMPTEL source.
Closest to the significance maximum is the source HESS J1825-137 (Aharonian et al. 2006b), a pulsar wind nebula that is also detected by Fermi/LAT at energies between 1 and 100 GeV (Grondin et al. 2011). Below 1 GeV the source is not detected by Fermi/LAT, consistent with the hard spectral power-law index of ~1.38 measured above 1 GeV. The SED, provided by Grondin et al. (2011), suggests an emission minimum in the COMPTEL band, which makes HESS J1825-137 an unlikely counterpart of the COMPTEL source.
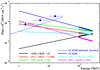 |
Fig. 5 Time-averaged COMPTEL energy spectrum of GRO J1823-12 for the sum of all data (see Fig. 3) compared to the extrapolations of the Fermi/LAT spectrum of the six closest γ-ray sources and to the extrapolation of the time-averaged X-ray spectrum (1−10 keV, dashed blue line) of LS 5039 as measured by Suzaku (Takahashi et al. 2009). The thick solid lines represent the spectral shape derived from best-fit Fermi/LAT integral fluxes between 100 and 300 MeV by assuming a power-law shape of fixed index. This index was derived by a power law throughout the Fermi/LAT energy band. The thin solid lines represent the spectral extrapolations down to 1 MeV. For the known Fermi/LAT sources, the spectral extrapolation for LS 5039 comes closest to the COMPTEL 10−30 MeV measurement. Also the power-law extrapolation of the Suzaku-measured X-ray spectrum is in reasonable agreement with the COMPTEL spectrum of GRO J1823-12. For more details see text. |
Spectral parameters for the Fermi/LAT sources as given in the 2nd Fermi Catalog (Nolan et al. 2012).
Apart from LS 5039, none of the other sources is discussed in spectral detail in the literature. To derive some estimates on their fluxes, we took the relevant values from the Fermi/LAT 2nd Source Catalog (Nolan et al. 2012). In particular we used the integral photon fluxes from the 100 to 300 MeV band and a fixed power-law shape of the energy spectrum, whose power-law index was derived by a likelihood analysis in the band from 100 MeV to 100 GeV (Nolan et al. 2012). The spectral extrapolation for LS 5039 is coming closest to the measured COMPTEL flux of GRO J1823-12 (see Table 4 and Fig. 5), reaching a flux value of 0.91 × 10⁻⁵ ph cm-2 s-1 compared to the measured value of 1.46 × 10⁻⁵ ph cm-2 s-1. In fact the sum of the extrapolated fluxes of the six sources is 2.28 in these units. It should be considered as an upper limit, because the Fermi/LAT spectra of some sources have curved shapes, “LogParabola” or “power law with exponential cutoff”. Assuming a power-law shape throughout the band results at the low end to an overestimaton of the flux values. Nevertheless, the extrapolated and measured flux values agree within roughly a factor of two. The values are given in Table 4, and their spectral comparison to the COMPTEL fluxes is graphically shown in Fig. 5.
Takahashi et al. (2009) measured the X-ray spectrum of LS 5039 with Suzaku between 0.6 and 10 keV very accurately. The power-law extrapolation of their time-averaged X-ray spectrum up to the COMPTEL energies yields a flux of 1.0 ± 0.1 × 10⁻⁵ ph cm-2 s-1 for the COMPTEL 10−30 MeV band, which agrees reasonably well with the derived COMPTEL flux of 1.46 ± 0.21 × 10⁻⁵ ph cm-2 s-1. The error on the extrapolated X-ray flux is estimated by using the 1σ error on the measured power-law index of Takahashi et al. (2009). The comparison of the extrapolation of the X-ray spectrum to the COMPTEL fluxes is graphically shown in Fig. 5.
4.2. Orbit-resolved analyses
4.2.1. The INFC and SUPC orbital periods
In recent years it has become obvious that the microquasar LS 5039 is a significant γ-ray emitter (Aharonian et al. 2005) whose γ-ray radiation is modulated along its binary orbit of ~3.9 days (Aharonian et al. 2006a; Abdo et al. 2009). This orbital modulation provides a unique signature for identifying an unidentified γ-ray source as the counterpart of the microquasar.
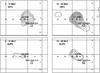 |
Fig. 6 COMPTEL 3−10 and 10−30 MeV significance maps of the LS 5039 sky region, generated in galactic coordinates (l,b). The maps give the evidence for GRO J1823-12 for the orbital phase intervals INFC (orbital phase 0.45−0.90) and SUPC (orbital phase ≤0.45 and >0.9) of LS 5039. The contour lines start at a detection significance of 3σ (1 d.o.f. for a known source) with a step of 0.5σ. The locations of the simultaneously fitted known COMPTEL sources, LS 5039 (diamonds), PKS 1830-210 (square) are indicated. The quasar PKS 1622-297 and a possible source at the Galactic center, both out of the plot region, were also taken into account in the simultaneous fitting. We clearly find a more significant source for the inferior conjunction period. See text for more details on the maps. |
By using the ephemeris of Casares et al. (2005), which is determined from radial velocity measurements of the stellar component in 2002 and 2003, Aharonian et al. (2006a) measured a roughly sinusoidal flux variation along the binary orbit for photons above 1 TeV. They found in particular, that the bulk of the TeV flux is emitted along roughly half of the orbit at the phase interval Φ~ 0.45 to 0.9. The VHE flux maximum occurs near inferior conjunction (Φ = 0.716), while the VHE flux minimum occurs at Φ~ 0.2, slightly after the orbital superior conjunction at Φ = 0.058. To increase statistics for further analyses, they defined two broad phase intervals: INFC (0.45 < Φ ≤ 0.9), the orbital part around inferior conjunction, and SUPC (Φ ≤ 0.45 and Φ > 0.9) as the orbital part around superior conjunction. For INFC their phase-resolved analyses showed a bright TeV source (0.2 to 10.0 TeV) with a hard power-law spectrum (photon index ~1.85) and an exponential cutoff at roughly 9 TeV, while for SUPC a much weaker source showing a soft (photon index ~2.53) and continous power-law shape from 0.2 to 10 TeV.
These definitions of orbital phase intervals, INFC, and SUPC by Aharonian et al. (2006a), were susbsequently applied, in say, the analyses of Fermi/LAT γ-ray data at 100 MeV to 10 GeV (Abdo et al. 2009; Hadasch et al. 2012), INTEGRAL IBIS/ISGRI hard X-ray data at 13−250 keV (Hoffmann et al. 2009), and Suzaku X- and hard X-ray data from 1 to 60 keV (Takahashi et al. 2009). At all these wavelength bands, an orbital modulation of the microquasar emission was detected, although not always in phase with each other.
Because COMPTEL MeV detections of GRO J1823-12 are only possible by averaging a significant amount of data, e.g., one CGRO phase covering roughly one year, we cannot perform an independent periodicity search. However, we can use the known orbit ephemeris of the microquasar and subdivide our data in sections with respect to orbital phase. As for the other instruments, we used the ephemeris of Casares et al. (2005), Porb = 3.90603 ± 0.00017 days with T0 = 2 451 943.09 ± 0.10 (HJD), as periastron passage (≡phase Φ = 0.0), for our orbit-resolved analyses. In a first step we subdivided the COMPTEL MeV data by this ephemeris into the two parts: INFC and SUPC. This resulted – for a given observational period – in two independent sets of data, which we then analysed by the standard COMPTEL analysis procedure (see Sect. 2). Figure 6 shows significance maps, for which the sum of all COMPTEL data are subdivided into the orbital intervals INFC and SUPC. The maps are generated for the two more reliable high-energy COMPTEL bands. We clearly detect a more significant source for the inferior conjunction period for both energy bands, despite the shorter exposure accumulated in this orbital part (Φ = 0.45−0.9) than in the SUPC part. This indicates that at least a significant fraction of this MeV emission is modulated with the ~3.9 day orbital period of the binary system, and – in fact – suggests it is in phase with the TeV emission. This makes LS 5039 very likely the counterpart of this MeV emission, so far designated GRO J1823-12.
As for the orbit-averaged analyses, we extracted fluxes at the location of LS 5039 (Table 5) and compiled spectra, which are fitted by power-law models (Fig. 7). For both orbital phase regions, INFC and SUPC, we find hard power-law spectra, with the trend toward being harder during the INFC period (Table 6).
A comparison of our COMPTEL 10−30 MeV fluxes to the extrapolated values of the spectra of Takahashi et al. (2009) for both the INFC and SUPC periods yields comparable values. We derive extrapolated fluxes (units 10-5 ph cm-2 s-1) of 1.5 ± 0.4 for INFC and 0.57 ± 0.12 for SUPC. They are quite comparable to the COMPTEL measurements of 2.15 ± 0.33 for INFC and 0.98 ± 0.28 for SUPC. The errors on the extrapolated values are estimated by using the 1σ errors on the measured X-ray slopes of Takahashi et al. (2009).
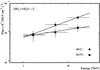 |
Fig. 7 COMPTEL energy spectra, extracted at the location of LS 5039, in an E2 × differential flux representation for the sum of all data. Two spectra are shown with their best-fit power-law shapes (solid lines), representing the orbital phase intervals INFC and SUPC. The fluxes are derived in the three standard COMPTEL energy bands (1−3, 3−10, 10−30 MeV). The error bars are 1σ. |
Fluxes, extracted at the location of LS 5039 for the sum of all data, subdivided into the two orbital phase intervals INFC (0.45 < Φ ≤ 0.9) and SUPC (Φ ≤ 0.45 and Φ > 0.9).
Results of the power-law fitting of the COMPTEL spectra (1−30 MeV) for the two orbital phase intervals INFC and SUPC.
4.2.2. Orbital light curve at MeV energies
To further test the orbital modulation of the MeV emission, we subdivided all COMPTEL data into 5 orbital phase bins. We chose this binning of 0.2 in phase because the COMPTEL data cover the time period between July 12, 1991 and January 25, 2000. The COMPTEL measurements therefore started ~3500 days before and ended ~375 days before the time T0 = HJD 2 451 943.09 ± 0.10 (equal to February 2, 2001), for which Casares et al. (2005) determined the applied ephemeris. Applying their period uncertainty (ΔP) of 0.00017 days, yields a phase uncertainty ΔΦ (ΔΦ = (ΔT × ΔP/P)) of ~0.15 at CGRO VP 5.0 and 0.017 at CGRO VP 907.0, the first and last COMPTEL observations of the LS 5039 sky region. On average, the phase error is ~0.08 during the COMPTEL mission with respect to the orbital solution of Casares et al. (2005), suggesting a phase binning of 0.2. Subsequently, we analyzed the COMPTEL 10−30 MeV data in five orbital phase bins according to the described analysis procedure (see Sect. 2). This data selection provides 1) the best source signal in orbit-averaged analyses and 2) the cleanest and most reliable COMPTEL data due to its low (compared to the lower COMPTEL energy bands) background, which was stable along the COMPTEL mission, e.g., unaffected by satellite reboosts.
We found evidence of an orbital modulation of the COMPTEL 10−30 MeV emission. The orbital light curve is shown in Fig. 8 and the derived flux values are given in Table 7. A fit of the light curve, assuming a constant flux, results in a mean flux value of (1.52 ± 0.21) × 10-5 ph cm-2 s-1 with a χ2-value of 8.34 for 4 degrees of freedom. This converts to a probability of 0.08 for a constant flux or of 0.92 (≡1.75σ) for a variable flux.
Although, we cannot unambigiously prove an orbital modulation of the COMPTEL 10−30 MeV emission, the evidence is strong. In addition to this formal 92% variability indication, the COMPTEL light curve follows the trend in phase and shape exactly as is found in other energy bands. In particular the light curve is in phase with the modulation in X-ray, hard X-ray, and TeV energies, i.e., a brighter source near inferior conjunction (Φ = 0.716) and a weaker one near superior conjunction (Φ = 0.058). The measured flux ratio of about a factor of 3 is roughly compatible to the flux ratios observed in the X-ray (e.g., Takahashi et al. 2009) and TeV-bands (Aharonian et al. 2006a). However, the modulation at the MeV band is in anticorrelation to the γ-ray band at energies above 100 MeV, observed by Fermi/LAT, where the source is brightest near superior conjunction and weakest near inferior conjunction by a flux ratio of 3 to 4 (Abdo et al. 2009). By using just the flux values of the phase bins including superior (0.0−0.2) and inferior (0.6−0.8) conjunction of Table 7, we derive a significance of ~2.5σ for a change in flux. This behavior provides strong evidence that GRO J1823-12 is, at least for a significant part, the counterpart of the microquasar LS 5039.
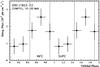 |
Fig. 8 Orbital light curve of LS 5039 in the 10−30 MeV COMPTEL band for the sum of all data. The light curve is folded with the orbital period of ~3.9 days and given in phase bins of 0.2. The two broader phase periods, defined as INFC and SUPC, are indicated. A flux increase during the INFC period is obvious. In the phase bin containing the inferior conjunction, the source is roughly three times brighter than in the phase bin containing the superior conjunction. In general the 10−30 MeV γ-ray light curve is consistent in phase and amplitude with the one at TeV γ-rays. |
Fluxes of a source at the location of LS 5039 for the sum of all COMPTEL data in the 10−30 MeV band along the binary orbit in orbital phase bins of 0.2.
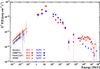 |
Fig. 9 X-ray to TeV γ-ray SED of LS 5039. The COMPTEL soft γ-ray spectra (sum of all data) for the INFC and SUPC orbital phases are combined with similar spectra from the X-ray (Suzaku, Takahashi et al. 2009), the MeV/GeV (Fermi/LAT, Hadasch et al. 2012), and the TeV band (HESS, Aharonian et al. 2006a) to build a high-energy SED of LS 5039. The SED shows that 1) the emission maximum at energies above 1 keV and 2) a switch in radiation dominance is occurring at MeV energies. The lines – solid and dashed – in the X-ray spectra represent the model calculations of Takahashi et al. (2009) on the emission pattern of LS 5039. They do not present a fit to their measured X-ray spectra. |
5. The SED of LS 5039 from X-rays to TeV γ-rays
The peculiar radiation behavior of LS 5039 is studied across the whole range of the electromagnetic spectrum. At high energies, the observational picture is available in the X- and hard X-ray bands (i.e., ~1 to 200 keV) and at γ-rays above 100 MeV, yielding a significant observational gap at the transition range from the X-rays to the γ-rays. Our analyses of the MeV data of GRO J1823-12, in particular the orbit-resolved ones, provide strong evidence of being the counterpart of the high-mass X-ray binary LS 5039. Figure 9 shows the high-energy – X-rays to TeV γ-rays – SED of the microquasar. We combine our 1−30 MeV spectra, collected for the INFC and SUPC parts of the orbit, with the similarly collected spectra at X-ray, GeV, and TeV energies, by assuming that the MeV emission is solely due to LS 5039. This may not be completely true since other γ-ray sources located within the COMPTEL error location region may contribute at a low level.
The COMPTEL measurements fill in a significant part of a yet unknown region of the SED, providing new and important information on the emission pattern of LS 5039. The SED shows that the emission maximum of LS 5039 occurs at MeV energies, i.e., between 10 and 100 MeV, and that the dominance in radiation between the INFC and SUPC orbital periods changes between 30 and 100 MeV, i.e., at the transistion region between the COMPTEL and Fermi/LAT bands. While for SUPC the SED suggests a kind of smooth transistion from COMPTEL to Fermi/LAT, it indicates a kind of complicated transition for the INFC period. For INFC the SED suggests a strong spectral break between the two bands with a drop in flux by a factor of 5 between 30 MeV and 100 MeV.
In general, the COMPTEL measurements shed light on an interesting region of the LS 5039 SED where the maximum of the high-energy emission of LS 5039 occurs and where significant spectral changes are happening. Therefore these COMPTEL results add important information on the emission pattern of LS 5039, and so provide additional constraints for modeling the microquasar.
6. Discussion
In recent years, after new γ-ray instruments became operational – in particular the ground-based Cherenkov telescopes HESS, MAGIC, and VERITAS and the γ-ray space telescope Fermi – , a new class of γ-ray emitting objects emerged: the “γ-ray binaries”. Many binary systems, even of different types like microquasars, colliding wind binaries, millisecond pulsars in binaries and novae, have now become confirmed emitters of γ-ray radiation above 1 MeV (see e.g., Dubus 2013 for a recent review). Confirmed VHE (>100 GeV) emission is still known for five binary systems, among them the microquasar candidate LS 5039.
LS 5039 is detected at γ-ray energies above 100 MeV by Fermi/LAT (Abdo et al. 2009; Hadasch et al. 2012) and above 100 GeV by HESS (Aharonian et al. 2005, 2006a) showing remarkable behavior in both bands: the flux is modulated along its binary orbit, however, in anticorrelation for the different waveband regions. Its γ-ray SED is generally “falling” from 100 MeV to TeV-energies. However, showing different shapes depending on binary phase. Its general behavior is not yet understood. Open questions are, for example, “Is LS 5039 a black-hole binary or a neutron-star binary?”, which relates to the question of whether the energetic particles necessary for the observed high-energy emission are accelerated in a microquasar jet or in a shocked region where the stellar and the pulsar wind collide, and “How this translates into the intriguing observed behavior”.
Because LS 5039 is now an established γ-ray source at energies above 100 MeV, for which crucial spectral and timing information has become available in recent years, we reanalyzed all available COMPTEL data of this sky region by assuming that the known but unidentified COMPTEL source GRO J1823-12 is the counterpart of LS 5039.
As in previous analyses (e.g., Collmar 2003), we found a significant MeV source that is consistent with the sky position of LS 5039, which in the COMPTEL 10−30 MeV band shows a kind of stable and steady flux level. By extrapolating the measured Fermi/LAT spectra of Fermi-detected γ-ray sources in the COMPTEL error box into the COMPTEL band, we find LS 5039 to be the most likely counterpart. This identification is supported by extrapolating the measured Suzaku X-ray spectra into the MeV band. Assuming no spectral breaks from keV to MeV energies, the extrapolations reach similar flux levels to the measured COMPTEL fluxes, for the orbit-averaged (see Fig. 5), as well as orbit-resolved, analyses.
Orbit-resolved analyses provide the most convincing evidence that GRO J1823-12 is the counterpart of LS 5039. A subdivision of the COMPTEL data into the so-called INFC and SUPC parts of the binary orbit results in a flux change of the MeV source. The flux measurements in the 10−30 and 3−10 MeV bands provide evidence at 2.7σ and at 1.6σ, respectively, that the fluxes for the two orbital phases are different. The combined evidence is 3.1σ. The analyses of the COMPTEL 10−30 MeV data, subdivided into orbital phase bins of 0.2, result in a variable MeV flux. The light curve is consistent in phase, shape, and amplitude with the ones observed at X-ray and TeV γ-ray energies, although the statistical evidence for variability is only 92%. We note that the errors on the fluxes always result from the fitting process combining four γ-ray sources and two diffuse galactic emission models.
By assuming that the fitted fluxes at the location of LS 5039 are solely due to LS 5059, i.e., neglecting possible unresolvable contributions of further (Fermi) γ-ray sources, we added our MeV flux measurements – although not simultaneous – to the measured high-energy SED of LS 5039 (Fig. 9). The SED shows that the major energy output of LS 5039 occurs at MeV energies, i.e., between 10 and 100 MeV, for both the INFC and SUPC orbital parts, the latter being the less luminous one. Both spectra show a broad spectral turnover from a harder spectrum below 30 MeV to a softer one above 100 MeV, resembling the IC-peaks in COMPTEL-detected blazar spectra, such as 3C 273 (Collmar et al. 2000b) or PKS 0528+134 (Collmar et al. 1997). The dominance of the MeV emission during the INFC part of the orbit proves that the spectral “flip-back” from a SUPC-dominated emission at energies above 100 MeV to an INFC-dominated emission occurs between 30 and 100 MeV.
Spectral modeling of the SED is beyond the scope of this paper. However, we would like to mention that a changing Compton scattering angle effect may generally account for the observed emission pattern. If one assumes that the collision of winds in a neutron star binary system provides isotropic and relativistic plasma and that the high-energy emission is due to inverse-Compton scattering of the stellar photons, typically ~9 eV for LS 5039, by the relativistic particles, one may need to take the Compton-scattering angular cross section into account. For the INFC orbital phase, the COMPTON-scatter angles for the photons reaching us are on average smaller than for the SUPC part. For INFC the primary photons have in principle the same direction as the IC-scattered photons, while for SUPC the primary photons take the opposite direction from the scattered photons, resulting on average in larger (SUPC) and smaller (INFC) scatter angles of the IC-process. Because the Compton cross section is dependent on the Compton scatter angle, this may result in different spectra of the observed radiation. A larger Compton scatter angle results in higher energy of the scattered photons but in lower probability, i.e., lower flux, and a smaller Compton scatter angle in a lower photon energy but with higher probability, i.e., higher flux. The plasma cooling is thus more effective for lower photon energies under small collision angles, resulting in an INFC-dominated spectrum at lower photon energies. The higher energy photons, however, are likely to be generated by large collison angles, which results in a SUPC-dominated spectrum at higher energies. If this is the main effect in LS 5039 for the keV to MeV energy range, it could explain our measurements: two almost parallel SEDs for SUPC and INFC, where for the lower energies (keV to MeV), the INFC flux is higher than the SUPC one, but for the higher energies (say above 100 MeV), the INFC flux is lower than the SUPC one.
At higher energies, say above 10 GeV, other effects, such as pair production and adiabatic cooling (e.g., Takahashi et al. 2009) will take over, the former leading to a higher INFC flux, while the latter leads to higher plasma energies at INFC, thereby causing the spectral difference between INFC and SUPC observed at TeV energies by HESS.
7. Summary and conclusion
LS 5039 is now an established γ-ray source at energies above 100 MeV, for which crucial spectral and timing information has become available in recent years. Because LS 5039 is spatially coincident with the known but unidentfied COMPTEL source GRO J1823-12, we analyzed the COMPTEL data of this sky region again by assuming that LS 5039 is the counterpart of GRO J1823-12. We reported the data analysis work in this paper.
We provided strong evidence that LS 5039 is the counterpart of GRO J1823-12. Individual statistical tests are not totally convincing by only reaching individually up to 3σ. However, from the sum of the analyses, we concluded that LS 5039 is – at least for the major fraction – the counterpart of the MeV source.
The derived absolute flux values, fitted at the sky position of LS 5039 and assumed to be from LS 5039, may be too slightly high because we cannot exclude underlying emission from other γ-ray sources that COMPTEL is unable to resolve. From the orbital light curve, we estimated them to be up to one third at most by assuming that the minimum emission is completely due to other sources. For the relative fluxes, we show that the source is brighter during INFC than during SUPC, which shows the dominance in radiation for LS 5039 has to flip back from SUPC at energies above 100 MeV to INFC between 30 and 100 MeV. This is an important result that provides a significant constraint for the source modeling. Adding the COMPTEL fluxes to the high-energy SED shows that the emission maximum of LS 5039 is at MeV energies. While the SUPC emission almost smoothly turns over from the Fermi/LAT band to the COMPTEL band, the INFC emission seems to show a strong break between the COMPTEL and the Fermi/LAT band. This behavior provides another important constraint for modeling the γ-ray binary.
The COMPTEL data have enlightened a part of the still “dark” region in the SED of the γ-ray binary LS 5039, thereby providing new insight into its emission processes by delivering new and important constraints for the source modeling.
Online material
COMPTEL observational periods of the GRO J1823-12 region during the CGRO mission, where the MeV source was within 35° of the pointing direction.
Acknowledgments
We thank D. Hadasch for providing the Fermi/LAT and HESS spectral points of the LS 5039 SED. S. Zhang acknowledges support from the Chinese NSFC 11073021, 11133002, XTP project XDA 04060604 and the Strategic Priority Research Program “The Emergence of Cosmological Structures” of the Chinese Academy of Sciences, Grant No. XDB09000000.
References
- Abdo, A. A., Ackermann, M., Ajello, M., et al. 2009, ApJ, 706, L56 [NASA ADS] [CrossRef] [Google Scholar]
- Aharonian, F., Akhperjanian, A. G., Aye, K. M., et al. 2005, Science, 309, 746 [NASA ADS] [CrossRef] [PubMed] [Google Scholar]
- Aharonian, F., Akhperjanian, A. G., Bazer-Bachi, A. R., et al. 2006a, A&A, 460, 743 [NASA ADS] [CrossRef] [EDP Sciences] [Google Scholar]
- Aharonian, F., Akhperjanian, A. G., Bazer-Bachi, A. R., et al. 2006b, A&A, 460, 365 [NASA ADS] [CrossRef] [EDP Sciences] [Google Scholar]
- Bloemen, H., Hermsen, W., Swanenburg, B. N., et al. 1994, ApJS, 92, 419 [NASA ADS] [CrossRef] [Google Scholar]
- Casares, J., Ribó, M., Ribas, I., et al. 2005, MNRAS, 364, 899 [NASA ADS] [CrossRef] [Google Scholar]
- Collmar, W. 2003, in Proc. of 4th AGILE Science Workshop, Frascati (Rome), on 11−13 June, 177 [Google Scholar]
- Collmar, W., Bennett, K., Bloemen, H., et al. 1997, A&A, 328, 33 [NASA ADS] [Google Scholar]
- Collmar, W., Schönfelder, V., Strong, A. W., et al. 2000a, AIP Conf. Proc., 510, 591 [Google Scholar]
- Collmar, W., Reimer, O., Bennett, K., et al. 2000b, A&A, 354, 513 [NASA ADS] [Google Scholar]
- de Boer H., Bennett K., Bloemen H., et al. 1992, in Data Analysis in Astronomy IV, eds. V. Di Gesù, L. Scarsi, R. Buccheri, et al. (New York: Plenum Press), 241 [Google Scholar]
- Dubus, G., 2013, A&ARv, 21, 64 [NASA ADS] [CrossRef] [Google Scholar]
- Grondin, M.-H., Funk, S., Lemoine-Goumard, M., et al. 2011, ApJ, 738, 42 [NASA ADS] [CrossRef] [Google Scholar]
- Hadasch, D., Torres, D. F., Tanaka, T., et al. 2012, ApJ, 749, 54 [NASA ADS] [CrossRef] [Google Scholar]
- Hartman, R. C., Bertsch, D. L., Bloom, S. D., et al. 1999, ApJS, 123, 79 [NASA ADS] [CrossRef] [Google Scholar]
- Hoffman, A. D., Klochkov, D., Santangelo, A., et al. 2009, A&A, 494, L37 [NASA ADS] [CrossRef] [EDP Sciences] [Google Scholar]
- Motch, C., Haberl, F., Dennerl, K., Pakull, M., & Janot-Pacheco, E. 1997, A&A, 323, 853 [NASA ADS] [Google Scholar]
- Nolan, P. L., Abdo, A. A., Ackermann, M., et al. 2012, ApJS, 199, 31 [NASA ADS] [CrossRef] [Google Scholar]
- Paredes, J. M., Martí, J., Ribó, M., & Massi, M. 2000, Science, 288, 2340 [NASA ADS] [CrossRef] [PubMed] [Google Scholar]
- Schönfelder, V., Aarts, H., Bennett, K., et al. 1993, ApJS, 86, 657 [NASA ADS] [CrossRef] [Google Scholar]
- Schönfelder, V., Bennett, K., Blom, J. J., et al. 2000, A&AS, 143, 145 [NASA ADS] [CrossRef] [EDP Sciences] [Google Scholar]
- Stephenson, C. B., & Sanduleak, N. 1971, Publ. Warner Swasey Obs., 1, 1 [Google Scholar]
- Strong, A. W., Collmar, W., Bennett, K., et al. 2001, AIP Conf. Proc., 587, 21 [NASA ADS] [CrossRef] [Google Scholar]
- Takahashi, T., Kishishita, T., Uchiyama, Y., et al. 2009, ApJ, 697, 592 [NASA ADS] [CrossRef] [Google Scholar]
- Weidenspointner, G., Varendorff, M., Bennett, K., et al., 1999, ApL&C, 39, 193 [NASA ADS] [Google Scholar]
- Zhang, S., Collmar, W., Bennett, K., et al. 2002, A&A, 386, 843 [NASA ADS] [CrossRef] [EDP Sciences] [Google Scholar]
- Zhang, S., Chen, Y.-P., Collmar, W., et al. 2008, ApJ, 683, 400 [NASA ADS] [CrossRef] [Google Scholar]
All Tables
Fluxes, assuming a source at the location of LS 5039 for the sum of all data (VPs 5.0–907.0).
Spectral parameters for the Fermi/LAT sources as given in the 2nd Fermi Catalog (Nolan et al. 2012).
Fluxes, extracted at the location of LS 5039 for the sum of all data, subdivided into the two orbital phase intervals INFC (0.45 < Φ ≤ 0.9) and SUPC (Φ ≤ 0.45 and Φ > 0.9).
Results of the power-law fitting of the COMPTEL spectra (1−30 MeV) for the two orbital phase intervals INFC and SUPC.
Fluxes of a source at the location of LS 5039 for the sum of all COMPTEL data in the 10−30 MeV band along the binary orbit in orbital phase bins of 0.2.
COMPTEL observational periods of the GRO J1823-12 region during the CGRO mission, where the MeV source was within 35° of the pointing direction.
All Figures
|
Fig. 1 COMPTEL 1−3 (left), 3−10 (middle) and 10−30 MeV (right) maps, generated in galactic coordinates (l,b), show the statistical evidence of GRO J1823-12 for the sum of all data. The contour lines start at a detection significance of 3σ (1 d.o.f. for a known source) with a step of 0.5σ. The location of the microquasar LS 5039 (diamond, l/b: 16.88°/−1.29°) and the lensed quasar PKS 1830-210 (square) are indicated; i.e., the locations of the simultaneously fitted COMPTEL sources. The quasar PKS 1622-297 and a possible source at the Galactic center, both out of the plot region, were also taken into account in the simultaneous fitting. The 10−30 MeV band yields the highest detection significance (7.8σ) at the position of LS 5039. |
| In the text | |
|
Fig. 2 COMPTEL light curves of GRO J1823-12, fitted at the sky location of LS 5039, in the 3−10 and 10−30 MeV bands. The flux points (integral photon fluxes for the given bandwidth) are averaged over individual CGRO phases or cycles, each covering roughly one year. For the details on the observations see Table 1. |
| In the text | |
|
Fig. 3 COMPTEL energy spectrum of GRO J1823-12, fitted at the location of LS 5039, in an E2 × differential flux representation for the sum of all data. The fluxes are derived in the 3 standard COMPTEL energy bands (1−3, 3−10, 10−30 MeV). The error bars are 1σ. The solid line represents the best-fitting power-law shape between 1 and 30 MeV. |
| In the text | |
|
Fig. 4 COMPTEL error location contours for the most significant COMPTEL detection of GRO J1823-12, obtained in the 10−30 MeV band for the sum of all data. The contour lines are plotted on a map in galactic coordinates (l,b) of the LS 5039-region. The error contours start with 1σ in steps of 1σ. The sky positions (circles) of all γ-ray sources, listed in the second Fermi catalog and are within a search radius of 2° around the pixel center of the best-fit source location (l/b:17.5°/−0.5°) are shown. |
| In the text | |
|
Fig. 5 Time-averaged COMPTEL energy spectrum of GRO J1823-12 for the sum of all data (see Fig. 3) compared to the extrapolations of the Fermi/LAT spectrum of the six closest γ-ray sources and to the extrapolation of the time-averaged X-ray spectrum (1−10 keV, dashed blue line) of LS 5039 as measured by Suzaku (Takahashi et al. 2009). The thick solid lines represent the spectral shape derived from best-fit Fermi/LAT integral fluxes between 100 and 300 MeV by assuming a power-law shape of fixed index. This index was derived by a power law throughout the Fermi/LAT energy band. The thin solid lines represent the spectral extrapolations down to 1 MeV. For the known Fermi/LAT sources, the spectral extrapolation for LS 5039 comes closest to the COMPTEL 10−30 MeV measurement. Also the power-law extrapolation of the Suzaku-measured X-ray spectrum is in reasonable agreement with the COMPTEL spectrum of GRO J1823-12. For more details see text. |
| In the text | |
|
Fig. 6 COMPTEL 3−10 and 10−30 MeV significance maps of the LS 5039 sky region, generated in galactic coordinates (l,b). The maps give the evidence for GRO J1823-12 for the orbital phase intervals INFC (orbital phase 0.45−0.90) and SUPC (orbital phase ≤0.45 and >0.9) of LS 5039. The contour lines start at a detection significance of 3σ (1 d.o.f. for a known source) with a step of 0.5σ. The locations of the simultaneously fitted known COMPTEL sources, LS 5039 (diamonds), PKS 1830-210 (square) are indicated. The quasar PKS 1622-297 and a possible source at the Galactic center, both out of the plot region, were also taken into account in the simultaneous fitting. We clearly find a more significant source for the inferior conjunction period. See text for more details on the maps. |
| In the text | |
|
Fig. 7 COMPTEL energy spectra, extracted at the location of LS 5039, in an E2 × differential flux representation for the sum of all data. Two spectra are shown with their best-fit power-law shapes (solid lines), representing the orbital phase intervals INFC and SUPC. The fluxes are derived in the three standard COMPTEL energy bands (1−3, 3−10, 10−30 MeV). The error bars are 1σ. |
| In the text | |
|
Fig. 8 Orbital light curve of LS 5039 in the 10−30 MeV COMPTEL band for the sum of all data. The light curve is folded with the orbital period of ~3.9 days and given in phase bins of 0.2. The two broader phase periods, defined as INFC and SUPC, are indicated. A flux increase during the INFC period is obvious. In the phase bin containing the inferior conjunction, the source is roughly three times brighter than in the phase bin containing the superior conjunction. In general the 10−30 MeV γ-ray light curve is consistent in phase and amplitude with the one at TeV γ-rays. |
| In the text | |
|
Fig. 9 X-ray to TeV γ-ray SED of LS 5039. The COMPTEL soft γ-ray spectra (sum of all data) for the INFC and SUPC orbital phases are combined with similar spectra from the X-ray (Suzaku, Takahashi et al. 2009), the MeV/GeV (Fermi/LAT, Hadasch et al. 2012), and the TeV band (HESS, Aharonian et al. 2006a) to build a high-energy SED of LS 5039. The SED shows that 1) the emission maximum at energies above 1 keV and 2) a switch in radiation dominance is occurring at MeV energies. The lines – solid and dashed – in the X-ray spectra represent the model calculations of Takahashi et al. (2009) on the emission pattern of LS 5039. They do not present a fit to their measured X-ray spectra. |
| In the text | |
Current usage metrics show cumulative count of Article Views (full-text article views including HTML views, PDF and ePub downloads, according to the available data) and Abstracts Views on Vision4Press platform.
Data correspond to usage on the plateform after 2015. The current usage metrics is available 48-96 hours after online publication and is updated daily on week days.
Initial download of the metrics may take a while.