Fig. 4
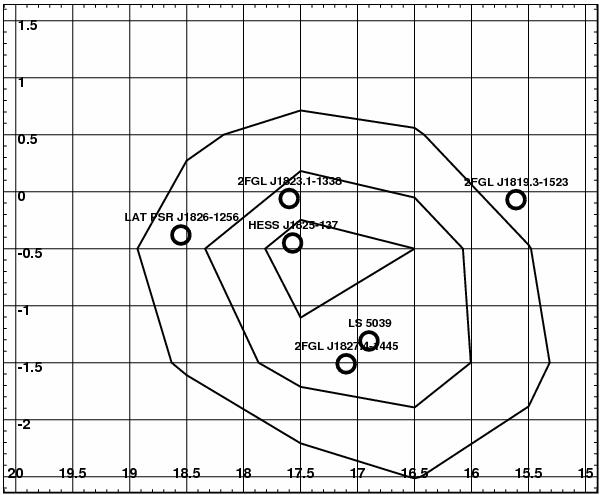
COMPTEL error location contours for the most significant COMPTEL detection of GRO J1823-12, obtained in the 10−30 MeV band for the sum of all data. The contour lines are plotted on a map in galactic coordinates (l,b) of the LS 5039-region. The error contours start with 1σ in steps of 1σ. The sky positions (circles) of all γ-ray sources, listed in the second Fermi catalog and are within a search radius of 2° around the pixel center of the best-fit source location (l/b:17.5°/−0.5°) are shown.
Current usage metrics show cumulative count of Article Views (full-text article views including HTML views, PDF and ePub downloads, according to the available data) and Abstracts Views on Vision4Press platform.
Data correspond to usage on the plateform after 2015. The current usage metrics is available 48-96 hours after online publication and is updated daily on week days.
Initial download of the metrics may take a while.