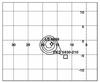
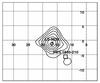
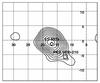
Fig. 1

COMPTEL 1−3 (left), 3−10 (middle) and 10−30 MeV (right) maps, generated in galactic coordinates (l,b), show the statistical evidence of GRO J1823-12 for the sum of all data. The contour lines start at a detection significance of 3σ (1 d.o.f. for a known source) with a step of 0.5σ. The location of the microquasar LS 5039 (diamond, l/b: 16.88°/−1.29°) and the lensed quasar PKS 1830-210 (square) are indicated; i.e., the locations of the simultaneously fitted COMPTEL sources. The quasar PKS 1622-297 and a possible source at the Galactic center, both out of the plot region, were also taken into account in the simultaneous fitting. The 10−30 MeV band yields the highest detection significance (7.8σ) at the position of LS 5039.
Current usage metrics show cumulative count of Article Views (full-text article views including HTML views, PDF and ePub downloads, according to the available data) and Abstracts Views on Vision4Press platform.
Data correspond to usage on the plateform after 2015. The current usage metrics is available 48-96 hours after online publication and is updated daily on week days.
Initial download of the metrics may take a while.