Fig. 7
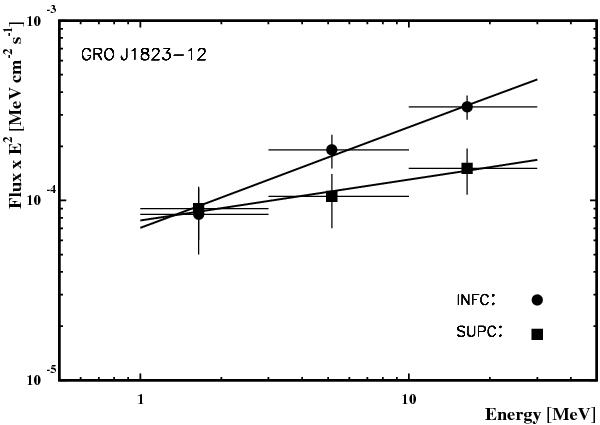
COMPTEL energy spectra, extracted at the location of LS 5039, in an E2 × differential flux representation for the sum of all data. Two spectra are shown with their best-fit power-law shapes (solid lines), representing the orbital phase intervals INFC and SUPC. The fluxes are derived in the three standard COMPTEL energy bands (1−3, 3−10, 10−30 MeV). The error bars are 1σ.
Current usage metrics show cumulative count of Article Views (full-text article views including HTML views, PDF and ePub downloads, according to the available data) and Abstracts Views on Vision4Press platform.
Data correspond to usage on the plateform after 2015. The current usage metrics is available 48-96 hours after online publication and is updated daily on week days.
Initial download of the metrics may take a while.