| Issue |
A&A
Volume 564, April 2014
|
|
|---|---|---|
| Article Number | A95 | |
| Number of page(s) | 15 | |
| Section | Interstellar and circumstellar matter | |
| DOI | https://doi.org/10.1051/0004-6361/201322388 | |
| Published online | 11 April 2014 | |
Faint disks around classical T Tauri stars: Small but dense enough to form planets⋆,⋆⋆
1 IRAM, 300 rue de la piscine, 38406 Saint Martin d’Hères France
2 Univ. Bordeaux, LAB, UMR 5804, 33270 Floirac, France
e-mail: This email address is being protected from spambots. You need JavaScript enabled to view it.
, This email address is being protected from spambots. You need JavaScript enabled to view it.
3 CNRS, LAB, UMR 5804, 33270 Floirac, France
4 Centro de Radioastronomìa y Astrofìsica, UNAM, Apartado Postal 3-72, 58089 Morelia, Michoacàn, Mexico
Received: 29 July 2013
Accepted: 7 February 2014
Abstract
Context. Most Class II sources (of nearby star-forming regions) are surrounded by disks with weak millimeter continuum emission. These “faint” disks may hold clues to the disk dissipation mechanism. However, the physical properties of protoplanetary disks have been directly constrained by imaging only the brightest sources.
Aims. We attempt to determine the characteristics of such faint disks around classical T Tauri stars and to explore the link between disk faintness and the proposed disk dispersal mechanisms (accretion, viscous spreading, photo-evaporation, planetary system formation).
Methods. We performed high angular resolution (0.3′′) imaging of a small sample of disks (9 sources) with low 1.3 mm continuum flux (mostly <30 mJy) with the IRAM Plateau de Bure interferometer and simultaneously searched for 13CO (or CO) J = 2−1 line emission. Using a simple parametric disk model, we determined characteristic sizes for the disks in dust and gas, and we constrained surface densities in the central 50 AU.
Results. All disks are much smaller than the bright disks imaged so far, both in continuum and 13CO lines (5 detections). In continuum, half of the disks are very small, with characteristic radii less than 10 AU, but still have high surface density values. Small sizes appear to be the main cause of the low disk luminosity. Direct evidence for grain growth is found for the three disks that are sufficiently resolved. Low continuum opacity is attested in only two systems, but we cannot firmly distinguish between a low gas surface density and a lower dust emissivity resulting from grain growth. Finally, we report a tentative discovery of a ~20 AU radius cavity in DS Tau, which with the (unresolved) “transition” disk of CX Tau, brings the proportion of “transitional” disks to a similar value to that of brighter sources. The existence of cavities cannot by itself explain their observed low mm flux.
Conclusions. This study highlights a category of very compact dust disks that still exhibit high surface densities, which may represent up to 25% of the whole disk population. While its origin is unclear with the current data alone, it may be related to the compact planetary systems found by the Kepler mission.
Key words: circumstellar matter / stars: pre-main sequence / binaries: visual / protoplanetary disks
Based on observations carried out with the IRAM Plateau de Bure interferometer. IRAM is supported by INSU/CNRS (France), MPG (Germany), and IGN (Spain).
Appendices A and B are available in electronic form at http://www.aanda.org
© ESO, 2014
1. Introduction
The many known exoplanet systems display tremendous variety in the masses of their stars, the masses of planets they host, and their architectures. Study of the early evolution of protostellar disks will contribute to our understanding of the origins of this diversity. “Faint” disks (defined as having 1.3 mm continuum flux ≲60 mJy at the Taurus distance, 140 pc) play a key role in this respect. First of all, most disks around Class II sources are “faint”. Andre & Montmerle (1994) find that 50% of the Class II sources in ρ Oph (at 120 pc) have 1.3 mm flux <40 mJy, while only 25% have flux >125 mJy. Similar statistics were obtained in the Taurus region by Beckwith et al. (1990). Second, young stars of mass <0.3 M⊙ (the most numerous in our Galaxy) are expected to be surrounded by low-mass, intrinsically faint disks from theoretical considerations. Until the work of Andrews et al. (2013), this trend was not clearly observed because of the incompleteness of the samples toward low masses (sensitivity). The large dispersion of disk continuum brightness as a function of stellar mass also loosen the expected correlation. Finally, low-mass stars with faint disks play a critical role in validating stellar evolution models. Providing accurate stellar masses in the 0.2−0.4 M⊙ range would allow critical tests of early stellar evolution models, hopefully offering better age estimates for all young stars to ultimately establish a more reliable clock for planetary system formation.
Disks can be “faint” for many different reasons. Low disk surface density is the simplest reason. Temperature also affects continuum flux, but varies over a much more limited range. Dust settling when seen at high inclination (> 80°, e.g., the edge-on objects HK Tau B, HV Tau C in Guilloteau et al. 2011) leads to smaller flux (see the study of Boehler et al. 2013), as the warmer parts are hidden by opacity. Disks may also just be small, such as BP Tau (Dutrey et al. 2003), sometimes as a result of outer disk truncation, as happens in binaries (e.g., Haro 6−10, UY Aur, Guilloteau et al. 2011; Duvert et al. 2000). On another hand, inner disk clearing, which suppresses the densest parts of the disk, is also observed in many objects (e.g., AB Aur, LkCa 15, MWC 758, Piétu et al. 2005, 2006; Isella et al. 2010). Finally, grain growth, which reduces the opacity per unit mass, can lead to small (sub)mm continuum flux densities.
Stellar properties.
These causes are not mutually exclusive: HH 30 (Guilloteau et al. 2008) combines small size, inner hole, and grain growth, as well as a somewhat lower-than-average surface density. The various possible causes have different observational consequences. Ricci et al. (2010) find a correlation between the spectral index α (S(ν) ∝ να) with S(1.3 mm), with α ≃ 2 for low flux densities. The value α = 2 indicates either optically thick emission or large grains (“pebbles”), as the dust emissivity index β = α − 2 in the optically thin case. However, the observed correlation fails to be reproduced by current models of disk evolution including grain growth and viscous evolution (Birnstiel et al. 2010, their Fig. 2). A trend toward smaller sizes at low flux (Andrews et al. 2010, their Fig. 7) supports the compact disk interpretation. Furthermore, since Guilloteau et al. (2011) showed that larger grains tend to be found in the inner 60−100 AU of disks, small disks are also expected to have lower α, producing the observed correlation between flux and spectral index.
Whatever the cause of the faintness, “faint” disks are essential objects for understanding the planetary system formation process. Grain growth and dust settling are major steps in this respect. Inner cavities can be signposts of planetary system formation, while disks with low surface density may be in the dust (and gas) dissipation stage. To separate between the possible causes, resolved images are essential. Because of the resolution and sensitivity limitations of the existing mm arrays, most studies have focused on the brighter objects (e.g., Andrews & Williams 2007; Isella et al. 2009; Guilloteau et al. 2011), so that resolved images of faint disks are rare. A first attempt was made by Andrews et al. (2010), who studied the continuum emission from some disks in the ρ Oph regions, six of which would qualify as “faint”, showing that on average these disks indeed appeared smaller than brighter ones. However, the sensitivity was insufficient to study the CO line emission.
We report here on a high angular resolution (0.4−0.6′′) study in line and continuum emission of nine disks in the Taurus complex, eight of them having Sν< 30 mJy at 1.3 mm, and the last one, CW Tau, is at the boundary between “faint” and “bright” disks with Sν ≈ 60 mJy.
2. Observations and data analysis
2.1. Source sample
Our sample consists of the eight disks from the Ricci et al. (2010) study that had no previous high angular resolution data: CW Tau, CX TauDE Tau, DS Tau, FM Tau, FZ Tau, HO Tau, and SU Aur. All of them have low 1.0 mm fluxes, ranging from 19 mJy to 70 mJy, with the exception of CW Tau, which is substantially brighter (129 mJy). We also observed V836 Tau, one of the rare stars in an intermediate stage between cTTS and wTTS (Duvert et al. 2000; Najita et al. 2008). Table 1 summarizes the properties of the selected stars. Substantial disagreement exists between the stellar properties reported by several authors, in particular for CW Tau and DS Tau, for which Ricci et al. (2010) indicate an unusually high age of 17 Myr. Table 1 gives the stellar properties derived by Bertout et al. (2007) and Andrews et al. (2013) using the Siess et al. (2000) evolutionary tracks.
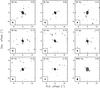 |
Fig. 1 Naturally weighted continuum images for all sources. Contour levels are − 3, 3, 6 12, 24, 48, and 96 times the noise level. Noise level (in mJy/beam) is indicated in the upper right corner of each panel. Only CX Tau has a potential secondary source: a 6σ signal (0.7 mJy) is located approximately 3.8′′ NE of CX Tau. Positions are relative to the coordinates in Table 1. |
2.2. Observations
Observations of the main sample were carried out with the IRAM Plateau de Bure interferometer, using the ABC configuration. The dual-polarization receivers were tuned near 220 GHz to cover the J = 2 − 1 transitions of 13CO and C18O. The equivalent wavelength for the continuum is 1.36 mm.
The C configuration was observed on Dec. 14, 2010, the B configuration on Feb. 13 and Mar. 5, 2011 and the A configuration on Feb. 20, 2013. Typical system temperatures were 90−150 K (only 0.5 mm of precipitable water vapor), 150−180 K, and 200−350 K resp.; with scattered clouds on Mar. 5, and 90−150 K for the A configuration. The rms phase noise was of order 30° for the C configuration, 20 − 50° for the A configuration, but rather high (50 − 70°) for the B configuration, resulting in a limited seeing. All eight sources were observed in snapshot mode, providing limited but well distributed uv coverage. This mode provides a uniform calibration for all sources. We obtain about two hours on source integration time for each source. The typical angular resolution is 0.6 × 0.4′′ at PA ~ 30° with either robust or natural weighting.
The narrow band correlator was set to cover the CO isotopologues with 0.05 km s-1 channel separation, later smoothed to 0.21 km s-1 spectral resolution. The typical point source sensitivity is 20 mJy per channel, corresponding to a brightness of 1.6 K.
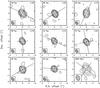 |
Fig. 2 Continuum images obtained with robust weighting. Contour levels are − 4, − 2, 2, 4, 8, 16, 32, 64, and 128 times the noise level. Noise level (in mJy/beam) is indicated in the upper right corner of each panel. Crosses indicate the orientation and aspect ratio of the disks derived from model fitting. Positions are relative to the coordinates in Table 1. |
The wideband correlator covered 4 GHz in each polarization, leading to a typical sensitivity of 0.13 mJy/beam. Phase noise, however, limits the dynamic range, especially on the brighter sources. These sources are compact and strong enough: we used one iteration of phase self-calibration, using an integration time of 120 s, bringing the effective image plane noise close to the theoretical value for the BC configuration. The self-calibration initial model retained only the first ten Clean components of the source: this is essentially equivalent to assuming the source is centro-symmetric, and we solve for the antenna phases under this assumption. For the fainter sources, the typical rms noise per antenna is 1.4 to 3.5 mJy (depending on the day) for a 120 s integration timescale, which in principle yields an antenna based rms of 9 to 25 degrees in the self-calibration process. Phase fluctuations on timescales between 45 s (the dump time used in these observations) and the 120 s integration time of the self-calibration process are not corrected. We checked that using a shorter integration time for the self-calibration process only brings limited improvements for the brighter sources, and in particular does not significantly affect the derived disk parameters.
The IRAM Plateau de Bure interferometer is equipped with 22 GHz radiometers that correct for phase errors on timescales from 1 s to 45 s, the current integration time per dump, leaving essentially Gaussian phase errors on these timescales with a mean rms around 30°. This first phase correction results in an essentially constant decorrelation factor, which is compensated by the amplitude calibration on the nearby quasars. The flux calibration was performed in comparison with MWC 349, which has a flux density of 1.9 Jy at 220 GHz. As some sources are bright enough, the consistency of the amplitude calibration between the different days could be checked, and was found to be on the order of 5%.
The phase corrections derived by self-calibration of the continuum data were transferred to the 13CO data. Positions of the detected sources are given in Table 1, with an astrometric accuracy of order 0.05′′. No proper motion corrections were applied, but using self-calibration implicitly corrects for any source motion over the two-year observing period.
The V836 Tau data were obtained separately (Project N035). Long baseline (B configuration) data was obtained on 27 Feb. and 3 Mar. 2004, and the C configuration was observed on 24 Nov. 2004. The single-polarization, dual-frequency receivers were tuned to the CO J = 2−1 and J = 1−0 frequencies. These data were merged with the compact configuration data from Duvert et al. (2000) obtained in 1997 Sep. 28 and Oct. 29. The effective rms noise for the continuum is 0.5 mJy/beam. Since these data only have 500 MHz of effective bandwidth (instead of 8 GHz for the other sources), we used a longer timescale of 480 s for the self-calibration.
Figure 1 shows the images obtained with natural weighting after self-calibration. All disks are well detected, and at this scale, appear very compact with essentially no significant residual emission in the field of view, except for two faint (0.7 mJy) point sources, one 4′′ N of CX Tau and another 7′′ NW of DS Tau. An enlarged view, using images generated with robust weighting to enhance the angular resolution, is shown in Fig. 2. Even on this scale, the sources appear compact, and furthermore, convolution by the elongated beam masks the intrinsic elongated aspect expected from inclined disks.
Continuum results.
2.3. Analysis method
We use the DiskFit tool (Piétu et al. 2007) to fit a parametric model of flared disks to the calibrated visibilities, in the same way as Guilloteau et al. (2011). For the continuum, since we only have images at one frequency, we used a number of simplifying assumptions:
-
a power law for the temperature
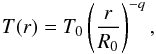 (1)with T0 = 15 K at R0 = 100 AU and an exponent q = 0.4;
 -
uniform dust properties, with a dust absorption coefficient κν(220 GHz) = 2 cm2 g-1, and an opacity scaling as νβ with frequency. We also assume a gas to dust ratio of 100;
-
two different surface density distributions, a simple truncated power law (Model 1)
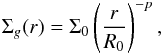 (2)for Rint<r<Rout, and a self-similar viscous law (Model 2)
 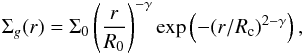 (3)for Rint<r;
 -
a flared geometry with a scale height
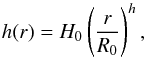 (4)with H0 = 16 AU, and h = 1.25.
The disks are then characterized further by the system geometry: position (x0,y0), inclination i and orientation PA. We follow the convention of Piétu et al. (2007) and indicate the PA of the disk rotation axis. The limited compromise in sensitivity and angular resolution precludes obtaining good independent constraints on the coupled parameters (p,Rout) in Model 1 or (γ,Rc) in Model 2. We thus assumed p = 1 for all sources in Model 1 and γ = 0.5 in Model 2, so that the outer radius Rout or the critical radius Rc become the sole indicator of the disk compactness. The validity of these assumptions was checked on the brightest source, CW Tau, where we found p ≈ 1.2 ± 0.4. The high-resolution images were complemented by flux measurements at 0.85 mm (from Andrews & Williams 2005) and near 3 mm (from Ricci et al. 2010) to allow a derivation of the dust emissivity index. The arbitrary choice of p or γ has a limited impact on the derived sizes. In Model 1, Rout would typically be ~15% smaller for p = 0, and ~5% larger for p = 2. In Model 2, using γ = 0 would increase Rc by 20%, while using γ ≥ 1 would result in much lower values, although the fit quality degrades significantly for the larger sources.
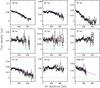 |
Fig. 3 Deprojected visibility profiles for the sources on a common relative scale, with best-fit profiles superimposed. Red is for the power-law fit, blue for the viscous profile. |
Given the sparse uv coverage, the analysis is done in the uv plane by fitting the observed visibilities to avoid nonlinear effects due to deconvolution. The flux measurements at other wavelengths are considered as zero-spacing visibilities: they only constrain β (and T0 for SU Aur). Results are given in Table 2. Figure 3 shows the visibilities and the model fit for all sources, after deprojection from inclination effects and circular averaging. As most sources are quite small, self-calibration is essential to measure the source size. Without self-calibration, the phase noise on the longest baselines results in a substantial seeing limitation, making the apparent characteristic size of the sources Rc> 20 AU. More details are given in Appendix A.
The errorbars in Table 2 were in general computed from the covariance matrix. However, this is not appropriate for several parameters. For highly inclined objects, the errorbar on the inclination is highly asymmetric. Similarly, for very compact sources, the errorbar on the radii (either Rc or Rout) must be asymmetric.
For these parameters, as well as for the position angle, we explored the χ2 curve as a function of parameter value, fitting all other parameters, to derive the 1σ errorbars or 3σ upper limits. Finally, although inclinations are sometimes highly uncertain, this has little impact on the derived characteristic radii: Rout is well constrained in all cases. These effects are described in more detail in Appendix B.
For the CO isotopologue results, we also assumed the CO surface density to be a power law. As for continuum, the signal-to-noise is insufficient for constraining the exponent of this power law: we assumed it to be p = 1.5, because measurements of spectral lines in general give steeper radial dependencies for molecules than for dust (e.g., Piétu et al. 2007). The continuum data was subtracted from the line data before performing the fit, as discussed in Piétu et al. (2007). The velocity field was assumed to be Keplerian, 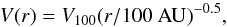 (5)and the local linewidth was set to 0.3 km s-1. The systemic velocity was derived from the fitting process. Orientation and inclinations were derived independently from the continuum. While these two parameters are affected by the amplitude calibration only for the continuum, they are essentially affected by the phase bandpass calibration for the line data. A good match between these independent derivations indicates that the calibration accuracy is not the limiting factor. The results of the CO isotopologue model fitting are given in Table 3. Errorbars were computed from the covariance matrix alone. The 13CO disk models are well constrained for CW Tau and also DS Tau, but should only be interpreted as a possible solution for the weaker sources CX Tau, DE Tau, and SU Aur.
The main uncertainty in our disk model is the temperature at 100 AU, T0. The 13CO results are relatively insensitive to the assumed temperature. However, concerning dust, temperature can affect the disk mass, which will scale as 1 /T for mostly optically thin emission, or the disk size for mostly optically thick emission in unresolved sources. We expect the effect to be small: our adopted value is reasonable given the typical disk size in our sample (see Sect. 4.4 for further discussion), and we already accounted for a higher value for SU Aur.
The next critical parameter is our choice of dust absorption coefficient at 220 GHz. Our adopted value, 2 cm2 g-1, is typical for the dust grains in disks. Guilloteau et al. (2011) used 2 cm2 g-1 (but at 230 GHz), while the dust model used by Andrews & Williams (2007) gives 2.1 cm2 g-1 at 220 GHz. However, if grains are substantially larger than 1 mm, the dust emissivity can be significantly reduced, see for example Fig. 5 of Isella et al. (2009) or Draine (2006). Thus, our reported disk masses are likely to be (rather conservative) lower limits (within the assumption of a standard gas to dust ratio).
3. Results
In all cases, there is good agreement between the geometry determined from the line data and the continuum results, which indicates that systematic effects are negligible because the continuum is affected by amplitude calibration fluctuations, while the spectral line data is mostly affected by bandpass calibration errors.
Results from CO isotopologues.
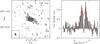 |
Fig. 4 Left: S/N map of the 13CO 2−1 emission towards CW Tau. The cross indicates the position, orientation and aspect ratio of the continuum disk. Contours are in steps of 2σ, with the zero contour omitted and negative contours dashed. Right: integrated 13CO 2−1 spectrum. |
CW Tau.
We have a clear detection of 13CO J = 2 − 1 in CW Tau. Guilloteau et al. (2013) showed that the line of sight towards this source is heavily affected by confusion with the surrounding molecular cloud. Accordingly, channels near the systemic velocity are unreliable tracers of the disk: confusion normally filters out emission, making the source appear smaller in these channels. It would thus lead to higher apparent inclination if those channels are included in the fit. To avoid this bias, we ignored channels in the velocity range 5.29 to 7.62 km s-1, which results in an increase in the errors on systemic velocity and inclination. The rotation is consistent with Keplerian rotation (velocity exponent 0.50 ± 0.04) around a 0.64 ± 0.08 M⊙ star. Because we ignored the central channels, the outer radius should be considered as a lower limit.
The errorbar on the 13CO column density appears unusually large compared to the other sources: this is because the line is partially optically thick. However, the detection of C18O, with an integrated line flux around 0.2 Jy km s-1, rules out high opacities for 13CO and can be used to obtain a better estimate. Assuming a standard isotopologue ratio of 8 between 13CO and C18O, the predicted column density of 13CO is 1015.7 ± 0.1 cm-2, similar to that of DE Tau.
The fit of the dust emissivity index β is solely based on the 1.35 and 3.57 mm data, because the continuum flux densities reported by Andrews & Williams (2005) appeared odd. Our predicted flux at 0.85 mm is 159 mJy, in excellent agreement with the result quoted in Andrews et al. (2013).
CW Tau is of spectral type K3, and the stellar mass derived by Bertout et al. (2007) from evolutionary tracks is 1.11 ± 0.15 M⊙, which is highly discrepant with our kinematical determination. Kenyon & Hartmann (1995) indicate an age estimate of 11 Myr. Andrews et al. (2013) have revised the stellar luminosity upwards to ~2.4 L⊙, which (for a K3 spectral type) makes the star substantially younger (~2−5 Myr), but also more massive. The source would be much younger if one adopts a later spectral type in agreement with the kinematical mass, and would become more consistent with stellar ages in Taurus.
CX Tau.
In continuum, the apparent size is only determined by the longest baseline data, and thus affected by phase noise. After self-calibration, the data is consistent with a very marginally resolved disk. However, the inclination is highly uncertain: any value above 20° is acceptable.
There is a 5−6σ detection of 13CO emission from this object (see Fig. 5), with an integrated line flux around 0.4 Jy km s-1. Using a fixed inclination of ~60° inclination and assuming Keplerian rotation, a disk model fit indicates a moderately resolved disk orbiting a star of mass around 0.4 M⊙, in reasonable agreement with its spectral type and derived stellar mass from evolutionary tracks (Table 1).
The systemic velocity, VLSR ~ 9 km s-1, appears unusual for the Taurus region, where the stellar velocities cluster around 6 km s-1. However, the Taurus region has several velocity components, and the molecular cloud velocity is around 8 km s-1 in this direction (see Fig. 12 of Goldsmith et al. 2008). CX Tau is one of the objects classified as “transition disks” from its spectral energy distribution (SED), because of the deficit of near Infrared emission (Najita et al. 2007), which indicates a reduced opacity in the inner AUs in the IR domain.
DE Tau.
There is a weak 13CO detection, with an integrated line flux around 0.4 Jy km s-1. Orientation and inclinations agree with those derived from the continuum emission, with large uncertainties given the small disk size, and the derived dynamical mass is ~0.11 M⊙, but the fit is rather poor (see Fig. 6). DE Tau is of spectral type M2, which would be more compatible with a stellar mass of 0.4 M⊙ (see Table 1).
DS Tau.
This source has the largest dust disk in our sample, with a characteristic radius twice larger than any other one. The continuum visibilities suggest the existence of an inner hole. The best fit radius for such a hole is 15 ± 5 AU in the power-law model, and slightly larger, 20 ± 4 AU, for the viscous profile.
There is a clear 13CO detection, with an integrated line flux around 0.5 Jy km s-1 (see Fig. 7). The disk parameters are well determined, and indicate a small gas disk (180 AU outer radius), with low 13CO surface density. The rotation is consistent with a Keplerian law (exponent 0.50 ± 0.08), and the implied stellar mass is 0.77 ± 0.07 M⊙. The 13CO data are also consistent with the existence of an inner cavity, with a best fit inner radius of 30 ± 9 AU. C18O is at the limit of detection, with an [13CO/C18O] isotopologue ratio of about ~8.
DS Tau is part of a visual binary, with a one magnitude fainter companion (called DS Tau/c or DS Tau B) located ~7.1′′ to the NW (at PA 294°, Moneti & Zinnecker 1991), but DS Tau is usually considered as a single star, because the companion has no Hα emission and no IR excess (Hartmann et al. 2005). Both Moneti & Zinnecker (1991) and Leinert et al. (1993) conclude that the probability of chance association with a background star is high, especially since the cloud visual extinction is low in this direction. However, we have a ~4.5σ (0.7 mJy) signal exactly at this position (7.2′′ at PA 292°, see Fig. 1), which argues that the visual binary is indeed a common proper motion pair comprising a cTTs and a wTTs/Class III source.
FM Tau.
This source is affected the most by self-calibration. The analysis favors a marginally resolved, highly inclined disk, but the errorbars on the inclination are large: any value above 20° is acceptable at the 3σ level.
FZ Tau.
FZ Tau also appears very compact. The inclination is <70° at the 3σ level. The position angle is only constrained if the inclination is >40°.
HO Tau.
The disk is well resolved, with a similar size to that of CW Tau. However, no 13CO is detected. Assuming the gas disk would have a similar size to those of CW Tau or DS Tau, the non-detection implies an upper limit of 1014.8 cm-2 for the 13CO surface density at 100 AU, i.e. four to ten times smaller than in the other detected disks.
HO Tau appears to be the oldest star in our sample, even with the age of 9 Myr indicated by Ricci et al. (2010).
SU Aur.
SU Aur was not properly centered in the primary beam1 in the initial observations. This pointing error was corrected for the A configuration, and a correction for primary beam attenuation was applied to the mispointed data sets (a factor ~1.7 given the 9′′ offset).
The continuum is essentially unresolved. This can be consistent with a 10 AU radius optically thick disk with T100 = 15 K. However, the high submm flux (~70 mJy at 850 μm Andrews & Williams 2005) favors a warmer disk, which is then somewhat optically thinner. With T100 = 30 K, a better overall solution is found. The size may also be slightly underestimated because for the most compact configurations, the source was placed near the half power beam, and thus the amplitude calibration is a critical function of pointing errors. However, the amplitude error should not exceed 20%, still leaving the source quite marginally resolved. The quoted sizes and β assume T100 = 30 K.
13CO is clearly detected. The total flux is ~1.1 ± 0.4 Jy km s-1. The derived line parameters are in good agreement with the 30-m data of Guilloteau et al. (2013) (line flux 1.7 ± 0.4 Jy km s-1, systemic velocity 7.1 ± 0.3 km s-1, line width 3.0 ± 0.5 km s-1). The 13CO emission is fairly complex. There is extended emission, spread about ~3−5′′ in the E-W direction, with a relatively narrow line, and the bulk of the emission is offset by ~0.5′′ from the continuum peak (see Fig. 8). It is possible to model the observed emission by a Keplerian disk orbiting a ~1.2 M⊙ star, centered on the continuum emission peak, However, such a model misses emission N of the star, and the disk parameters are not well constrained, apart from the 13CO column density.
The disk inclination and orientation derived from CO emission agree well with the inner disk rim properties inferred from IR interferometric studies by Akeson et al. (2002). An IR nebulosity was detected by Chakraborty & Ge (2004) SW of the star, while an optical emission extending few arcsec westward of the star has been reported by Nakajima & Golimowski (1995). Our disk orientation favors the first scenario proposed by Chakraborty & Ge (2004), where the IR nebulosity would result from the opening of a cavity in the surrounding molecular cloud by the stellar outflow. We note that degrading the spatial resolution in the uv plane results in a detection of extended 13CO emission spreading a few arcsec from the star in the western direction, with a good overlap with the optical emission seen in HST images. In any case, the IR nebulosity extends much farther out than the disk outer radius reported in our study (even in 13CO) and is more likely to trace a residual envelope or parent cloud emission rather than the disk itself.
V 836 Tau.
is one of the few objects with characteristics at the limit between cTTs and wTTs from its variable Hα emission and, from its SED, between Class II and III (Najita et al. 2008). As such, it may be a system in which the disk is being dissipated and just becoming optically thin. We find that the dust emission is largely resolved, with a characteristic radius Rc ~ 25 AU. It is similar in many respect to HO Tau. Here, the low molecular content is indicated by its very weak 12CO emission (Duvert et al. 2000). The β index determination uses the 3 mm flux densities from Duvert et al. (2000), 3.0 ± 0.8 at 3.4 mm, and 7.7 ± 1.2 at 2.7 mm, and the 850 μm data from Andrews & Williams (2005).
4. Discussion
4.1. General properties
From Table 2, half of the sources in our sample are clearly very compact: CX Tau, FM Tau, FZ Tau, and SU Aur are at best only marginally resolved in continuum. For these sources, in practice, we can only set upper limits on Rc and, in favorable cases, lower limits on i. In these objects, the density profile is not constrained by our observations, and optically thick disks would represent the observations equally well. With our adopted temperature profile, a (face on) optically thick core of outer radius Rthick has a flux of 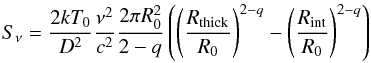 (6)which for T0 = 15 K, R0 = 100 AU, and q = 0.4 is 15 mJy at 220 GHz for Rthick = 7 AU at the Taurus distance (D = 140 pc). Although the errorbars of the characteristic radius are difficult to ascertain for the most compact sources, a simple look at the visibility profile indicate that these sources must be smaller than the smallest resolved one, DE Tau, implying Rout< 20 AU, but still large enough to provide sufficient flux, implying Rout> 7 AU. A more complete exploration of the errorbars is given in Appendix B. As expected, the smallest disks, which are essentially unresolved and have flux density in the range 9−15 mJy, are consistent with being optically thick. Since our adopted opacity is κ(220 GHz) = 0.02 cm2 g-1, this implies a minimal surface density of 50 g cm-2 and a minimal disk mass of ~10-3M⊙ for such disks. Given the errors, we actually find only minimal surface densities of 7 g cm-2 for FM Tau and CX Tau, and 20 g cm-2 for FZ Tau and DE Tau. Higher temperatures would reduce the required outer radius as
  and mass as 1 /T. This temperature dependence explains why SU Aur is optically thin.
The small sizes are also confirmed by the CO isotopologue results. The gas disks also are much smaller than the ~500 AU more typical of brighter disks. However, as in most other resolved disks, the spatial extent in the CO isotopologues appears to be substantially larger (by a factor 2 to 6) than the characteristic radius in the continuum.
Because the majority of the disks are essentially unresolved, we also cannot constrain the dust emissivity index β, since the whole disk can be optically thick at all wavelengths shorter than 3 mm. We thus have significant measurements of β only in the four disks that are large enough to rule out large optical depth: the brightest one, CW Tau, and three faint ones, HO Tau, DS Tau and V836 Tau.
4.2. Origin of disk faintness
Although the sample is limited in size, a number of properties emerge from this study.
Small disks:
small disk size is the main cause of low disk flux. A substantial fraction of these “faint” disks, of order 50% in our sample, are so small that they remain basically unresolved, with characteristic sizes ≤10 AU. These small disks are essentially consistent with being optically thick down to 3 mm, a result which by itself can explain the apparent α = 2. The minimal surface density at ~10 AU is on the order of 50 g cm-2: this is quite comparable with what is derived for much larger and brighter disks like CY Tau, DM Tau, or MWC 480 (see Guilloteau et al. 2011, their Fig. 12). Evidence of grain growth in these very small disks is lacking, since no observation reaches the optically thin regime so far.
Inner cavities:
we have a tentative detection of an inner cavity in DS Tau. The missing flux that might be attributed to the existence of the cavity is not large enough to explain alone the low mm flux of DS Tau: its contribution would be at most 10 mJy for DS Tau. As CX Tau has been classified as a “transition disk” from its near-IR SED, the DS Tau cavity makes the fraction of “transition disks” potentially as high as 20% in our sample, comparable to what has been found for brighter, larger disks (e.g., Andrews et al. 2011). Najita et al. (2007) argues that this fraction was decreasing with disk mass (or more precisely, continuum flux). Owen & Clarke (2012) suggests that “transition disks” are made of two distinct populations. However, the identification of central cavities has often been based on IR modeling alone. In practice, cavities of 20−40 AU radii were often detected at mm wavelengths: e.g., the first detection in LkCa 15 by Piétu et al. (2006), or HH 30 (Guilloteau et al. 2008). Confirming the existence of cavities in fainter sources is a challenging task that requires higher angular resolution and sensitivity that are only reachable by ALMA.
Low surface density:
we have two well-resolved disks with similar sizes (CW Tau and HO Tau, Rc ~ 20 AU), but widely different β. On one hand, the fainter one has β ≃ 0, so that its lower flux may be explained by grain growth rather than by a lower disk mass/surface density. On the other hand, 13CO is only detected in the brighter disk: this suggests that the gas content of HO Tau is indeed smaller than that of CW Tau. V836 Tau, a transition object between Class II and Class III types, appears very similar to HO Tau, although with larger errors.
For the other objects, the 13CO surface densities at 100 AU are comparable to those measured at 300 AU in the large disks studied so far such as DM Tau, LkCa15 or MWC 480 (Piétu et al. 2007). Extrapolation of the later values to smaller radii is difficult because of the substantial optical depth in 13CO: Piétu et al. (2007) find rather large p exponents, but a flattening of the surface density distribution inwards is not excluded. The newly detected disks only appear as down-sized versions of the large ones, but do not necessarily have lower surface densities in the inner 10 to 20 AU.
Grain growth:
direct evidence of grain growth exists for three of the four resolved disks: DS Tau, HO Tau and V836 Tau, which all have β ~ 0. However, we cannot determine the relative importance of grain growth in lowering the mm emission compared to a possible low surface density, as these three sources have various degree of (13)CO surface densities. Because of the possible contribution by an optically thick core, the dust emissivity index is ill constrained in the more compact sources, and the α − 2 value (where α is the spectral index of the emission) is only a stringent lower limit. In fact, there is no significant correlation between the disk “size” Rc and β, as shown by Fig. 9. Such a correlation is expected on the basis of enhanced dust growth in the inner parts of the disk, which leads to a variation in the dust emissivity index β as a function of radius. Lower values of β for radii smaller than ≈60 AU have been found by Guilloteau et al. (2011) for all sufficiently resolved disks in their sample, except of course those with large inner cavities devoid of dust. A similar result has been obtained for AS 209 with higher signal-to-noise by Pérez et al. (2012) through multi-frequency observations with sub-arcsec resolution. Unfortunately, sources in the current sample are not resolved enough to extend this property to small disks.
CW Tau, which is small but has β ~ 1.3, appears to be an exception to the trend found by Guilloteau et al. (2011). Although its evolutionary status is unclear because of the discrepancy between the derived dynamical mass and spectral type, it may be quite young given its relatively high luminosity, so that its high β value could be related to this young age.
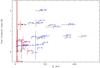 |
Fig. 9 Dust emissivity index β as a function of characteristic radius Rc. Sources in blue are from Guilloteau et al. (2011), and in red from this work. |
DS Tau, which exhibits a (relatively) large disk with low surface density, inner cavity, and evidence of grain growth, and which forms a common proper motion pair with a Class III/ wTT star, may be a case of a system caught in the stage of dissipation. We note, however, that DS Tau still exhibits a substantial accretion rate, much larger than expected for photo-evaporation to play a significant role in the disk dissipation (e.g., Gorti et al. 2009).
4.3. Towards a new population of small, dense disks?
Although the observed disks show a range of sizes, they are all much smaller than those studied by Guilloteau et al. (2011). This is clearly demonstrated by Fig. 10 which shows a scatter plot of the characteristic radius Rc (rederived from the results of Guilloteau et al. 2011, under the assumption of γ = 0.5) and 230 GHz flux density.
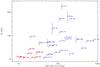 |
Fig. 10 Characteristic radius Rc as a function of 230 GHz flux density. Sources in blue are from Guilloteau et al. (2011), and in red from this work. |
Not only the dust disks, but also the gas disks appear much smaller than in previously studied sources. The gas disk radii range between 50 and 220 AU, while the 30 disks with molecular emission detected by Guilloteau et al. (2013) (out of a sample of 47 objects) had outer radii >300 AU, the sensitivity limit of that study. Since the size distribution in Guilloteau et al. (2013) peaked near 300 AU, it is thus conceivable that the faint disks detected here constitute the low end tail of the disk size distribution.
Our study reveals for the first time a population of very small (dust and gas) disks, but whose surface density in the inner 10 AUs does not necessarily differ from that of the much larger disks studied so far. There is no obvious explanation for this difference in sizes. We briefly explore here some possibilities.
-
Tidal effects: tidal truncation does not appear to play a significant role, since all sources are single, except DS Tau. Binary separation in the range 40−500 AU would be required to restrict the disk sizes (in line and continuum) to the observed values, while no companion has been found at such distances with typical contrast limits of about Δm ≃ 5 from IR/optical studies of these stars (e.g., Ghez et al. 1993; Kraus et al. 2011, for even closer companions). For the wide visual binary DS Tau, tidal effects must be weak, unless the companion is on a very eccentric orbit. Furthermore, DS Tau is the largest disk in our sample. Only one other source shows possible emission from a hidden companion: a 6σ signal is found 3.8′′ NE of CX Tau, with a flux of 0.7 mJy, but at this level, contamination by extragalactic high-redshift sources is not excluded. It is also unlikely that these small disks are due to past tidal truncation in multiple systems, followed by ejection of the observed component, as the stars velocities (Table 3) and proper motions (Ducourant et al. 2005) do not deviate from those of the Taurus association members. Only CX Tau exhibits a rather unusual velocity, but it differs only by ~1.5 km s-1 from that of surrounding molecular cloud (see Sect. 3).
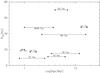
Fig. 11 Dust disk radius Rout as a function of the system’s age.
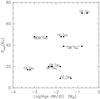
Fig. 12 Dust disk radius Rout as a function of the product age × mass accretion rate.
-
Age: disks around the youngest objects (e.g., HL Tau, DG Tau, Haro 6−13) were found to be more centrally peaked by Guilloteau et al. (2011, see their Fig. 12), possibly because they have not yet been spread out by viscous dissipation. Here, the observed stars are not particularly young (see Fig. 11). Some even have estimated ages that are at the high end of ages in the Taurus Auriga region, in excess of 10 Myr. Note that ages may not all be dependable (specially for CW Tau, see Sect. 3).
-
Low viscosity: lower viscosity may have kept the disks small. Indeed, these faint disks have somewhat lower accretion rates than average (taking the median value log(Ṁ) = −7.6 from Najita et al. 2007). However, there is no clear correlation between the product of the mass accretion rate Ṁ with the age of the star t∗, (Ṁt∗) and the characteristic radius Rout, although this would be expected in a viscous evolution model since both quantities scale as the effective viscosity (see Fig. 12). Moreover, we have to explain two very different sizes here: the gas disk sizes, ~100−200 AU, which can easily be accommodated by somewhat reduced viscous spreading, and the dust disk sizes, which are much smaller (~10−30 AU).
-
Layered dead zone: one possibility in this direction would be that the observed dense, possibly optically thick, continuum cores are direct manifestations of the (magnetically) dead zones, as predicted by models of Zhu et al. (2010), with 13CO line emission coming from the more viscous and diffuse surrounding disk. Our sensitivity is insufficient for detecting line emission from the inner 20 AU, making us unable to probe the change in surface density predicted by these models. Brighter, larger, disks may also exhibit optically thick (continuum) cores of size comparable to the ones found in our sample, and may only differ from the fainter ones by the outer, viscous disk component.
-
Planetary system formation: we may speculate that the very compact dust disks are due to dust shepherding by (proto)planets at a few AU from the stars, which would result in a dense ring of large grains just outside the planet’s orbit. Gas and small dust would be much less affected and could still extend out to 150−200 AU by viscous spreading. CX Tau, which shows signs of an evacuated inner cavity through its NIR deficit, and DS Tau, where our data reveal a potential ~20 AU radius cavity, are good candidates to probe such a mechanism. Much higher angular resolution studies will be needed to explore this possibility.
-
Just born small? Perhaps the simplest alternative is that such disks are just born small because they originate in the low-end tail of the initial angular momentum distribution of collapsing cores. A quantitative comparison is, however, difficult, because of large uncertainties on both sides. For the disks, the extrapolations of the initial radii are extremely hazardous (see Guilloteau et al. 2011), and the total angular momentum is sensitive to the surface density in the outer parts, which is ill-constrained. On the other hand, for molecular clouds, the derivation of angular momentum from observations remains difficult (Dib et al. 2010).
4.4. Consequences
Andrews et al. (2013) found that 50% of T Tauri stars in the Taurus Auriga region have mm flux <25 mJy at 1.3 mm. Our limited sample suggests that half of them could be due to very compact disks with high surface densities. The other half is a combination of several effects. Grain growth obviously plays a role, but the β values found for these disks is not different from what is found in the inner parts of big disks by Guilloteau et al. (2011). Disk dispersal (a reduction in surface density) is difficult to distinguish from grain growth, although the low 13CO line flux suggests that it may affect 30 to 40% of the sources. These conclusions are only valid for stars of mass >0.3−0.4 M⊙, as our sample includes no stars with spectral type later than about M2.
The existence of a category of very small disks has consequences on the relation between disk mass Md and mm flux Sν:  (7)where D is the distance, Td the effective mean dust temperature, and Δ ≥ 0 an opacity correction factor. Δ = 0 for optically thin dust, but can become arbitrary large if the optical depth is large. While Δ can be shown to be in general small for large disks (radii >100 AU, e.g. Beckwith & Sargent 1991; Andrews et al. 2013), it may be dominant for the very compact disks.
The small disk size also has an impact on the mean temperature, since the dust temperature decreases with distance to the star. For Rout = 20 AU, T0 = 15 K at R0 = 100 AU and q = 0.4, we find Td = 35 K, a value that is somewhat above the Td = 25(L∗/L⊙)1 / 4 K found by Andrews et al. (2013) using a 200 AU radius disk model. The combination of optical depth and temperature effects will influence the dispersion around the Sν/M∗ correlation. These effects must be kept in mind when using flux densities as a proxy for disk masses, because such conversions often implicitely assume that disks are sufficiently large.
Birnstiel et al. (2010) used a comprehensive dust disk evolution model that includes coagulation and fragmentation and compared its predictions to the Taurus/Ophiucus observations of Ricci et al. (2010). While they could reproduce the spectral index distribution between 1 and 3 mm, the model was overpredicting the 1 mm flux. However, they only considered a single disk surface density shape with Rc = 60 AU and γ = 1. Our results indicate that a substantial fraction of the fainter disks have much smaller sizes, and that this is the main reason for the weaker fluxes.
The high surface densities in the inner 10 AUs also imply that giant planet formation can still occur in these overall less massive, but much smaller, disks. The existence of a population of very compact disks may be related to the closely packed compact planetary systems discovered by the Kepler mission, such as Kepler 11 (Lissauer et al. 2013) or Kepler 33 (Lissauer et al. 2012), since the inner regions of most faint disks seem to retain enough gas content to form multiple systems of low-mass gaseous planets in the first AUs.
Finally, it may be worth stressing that essentially all estimates of surface densities in the inner 10 AU for large disks are extrapolations from larger radii. Apart from disks with inner cavities, current observations cannot rule out that most disks exhibit a dense inner core of ~10 AU radius which remains optically thick at all mm wavelengths.
5. Conclusions
We report the first high angular resolution study of disks with low level of continuum emission at mm wavelengths. We find that these disks are substantially smaller than the brighter ones imaged so far. A majority of them remains essentially unresolved at 0.4′′ resolution, leading to radii <15 AU. These disks are small enough to be optically thick at 1.4 mm, which provides a simple explanation for their apparent spectral index α ~ 2.
Emission from 13CO has been detected in five disks. Although the gas distribution extends farther out than the apparent size of the dust emission (as in all other disks around T Tauri and HAe stars), its outer radius is also small compared to previously studied gas disks.
Only two disks (V836 Tau, an intermediate case between Class II and Class III sources, and HO Tau) have apparently low surface densities simultaneously indicated by their low opacity in continuum and by their low molecular content. These stars may be caught in the act of dissipating their disks. Despite its higher 13CO content, DS Tau, which forms a common proper motion pair with a Class III/wTT star, is another good candidate for a dissipating disk because of the possible existence of an inner cavity.
This study reveals a population of small disks whose surface density remains large in the central 10 AU region. This population had been ignored so far because of the limited sensitivity and angular resolution of previous observations. It may represent up to 25% of the whole disk population in Taurus. These disks apparently only differ from their larger siblings by their small sizes. The origin for such small sizes remains unknown and requires higher resolution observations with ALMA and the JVLA to be unveiled. Such observations would also reveal the ability of these disks to form planets.
Online material
Appendix A: Impact of seeing
Self-calibration is essential to measuring the intrinsic source size, since the original phase noise on the longest baselines is relatively high. To illustrate this problem, we also used a data set in which only the most compact configurations (for which the correlated flux is well above the noise) have been self-calibrated. The most affected disk parameters are given in Table A.1 for fully and partially self-calibrated data. The corresponding (derotated and deprojected) visibilities are shown in Fig. A.1 (to be compared with Fig. 3). The coherence loss for uv distances above 300 m is quite significant, allowing only a lower limit to the disk sizes to be derived for the more compact ones. Self-calibration has no strong impact on the derived disk orientations, and only a small one (due to seeing effects) on the inclination. As shown in Table A.1, the recovered flux is slightly larger, and the sources are more compact, requiring higher surface densities to reproduce the observations.
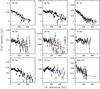 |
Fig. A.1 Deprojected visibility profiles for the sources on a common relative scale, with best-fit profiles superimposed. Partially self-calibrated version. Red is for the power-law fit, blue for the viscous profile. |
Effect of phase self-calibration.
Appendix B: Errorbar derivation
The use of the covariance matrix to estimate the errorbars is only well suited to the most resolved sources. For the more compact ones, errorbars on several parameters are necessarily asymmetric. The upper bound on Rout is determined by the visibility curves, while the lower bound is set by the necessity of providing a sufficient total flux. The value of Rout is thus well constrained even for these very compact sources. The inclination of the very compact sources is, of course, loosely defined, as it can only be constrained by measuring different sizes for different orientations of the baselines. However, this only has a moderate impact on Rout: as the contribution of an optically thick core is in general dominant,  is constant to first order, unless the disk becomes nearly edge-on.
To avoid any substantial bias on the derivation of Rout and its errorbars for small sources, we explored a two-parameter χ2 surface as a function of (Rout,i), fitting position, orientation, surface density and emissivity index. The results are presented in Fig. B.1. These figures show the expected behavior for Rout. The errors quoted in Table 2 are in general conservative: the lower bound on Rout is sharply constrained due to the flux requirement (see Eq. (6)).
In practically all cases, the optically thick solution (Σ > 50 g cm-2) is within 2σ of the best fit value. We also point out that given the unavoidable phase errors even after self-calibration, the residual seeing effects increase the best fit radius. The quoted best fit surface densities are thus lower limit in this respect, since only noise is included in the errorbars.
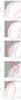 |
Fig. B.1 χ2 contours as a function of Rout and i for all compact sources (red contours, 1 to 5σ by increasing width), overlaid on the surface density values in gray scale. The surface density contours are 5, 10, 20, 40, 80 and 160 g cm-2 (of dust+gas, assuming a gas-to-dust ratio of 100). The source name is indicated in each panel. |
A typo in Ricci et al. (2010) give a position off by 9′′ in declination.
Acknowledgments
We thank A. Bacmann for help with the V836 Tau data. This work was supported by “Programme National de Physique Stellaire” (PNPS) and “Programme National de Physique Chimie du Milieu Interstellaire” (PCMI) from INSU/CNRS. This research made use of the SIMBAD database, operated at the CDS, Strasbourg, France.
References
- Akeson, R. L., Ciardi, D. R., van Belle, G. T., & Creech-Eakman, M. J. 2002, ApJ, 566, 1124 [NASA ADS] [CrossRef] [Google Scholar]
- Andre, P., & Montmerle, T. 1994, ApJ, 420, 837 [NASA ADS] [CrossRef] [Google Scholar]
- Andrews, S. M., & Williams, J. P. 2005, ApJ, 631, 1134 [NASA ADS] [CrossRef] [Google Scholar]
- Andrews, S. M., & Williams, J. P. 2007, ApJ, 659, 705 [NASA ADS] [CrossRef] [Google Scholar]
- Andrews, S. M., Wilner, D. J., Hughes, A. M., Qi, C., & Dullemond, C. P. 2010, ApJ, 723, 1241 [NASA ADS] [CrossRef] [Google Scholar]
- Andrews, S. M., Wilner, D. J., Espaillat, C., et al. 2011, ApJ, 732, 42 [NASA ADS] [CrossRef] [Google Scholar]
- Andrews, S. M., Rosenfeld, K. A., Kraus, A. L., & Wilner, D. J. 2013, ApJ, 771, 129 [NASA ADS] [CrossRef] [Google Scholar]
- Beckwith, S. V. W., & Sargent, A. I. 1991, ApJ, 381, 250 [NASA ADS] [CrossRef] [Google Scholar]
- Beckwith, S. V. W., Sargent, A. I., Chini, R. S., & Guesten, R. 1990, AJ, 99, 924 [NASA ADS] [CrossRef] [Google Scholar]
- Bertout, C., Siess, L., & Cabrit, S. 2007, A&A, 473, L21 [NASA ADS] [CrossRef] [EDP Sciences] [Google Scholar]
- Birnstiel, T., Dullemond, C. P., & Brauer, F. 2010, A&A, 513, A79 [NASA ADS] [CrossRef] [EDP Sciences] [Google Scholar]
- Boehler, Y., Dutrey, A., Guilloteau, S., & Piétu, V. 2013, MNRAS [Google Scholar]
- Chakraborty, A., & Ge, J. 2004, AJ, 127, 2898 [NASA ADS] [CrossRef] [Google Scholar]
- Dib, S., Hennebelle, P., Pineda, J. E., et al. 2010, ApJ, 723, 425 [NASA ADS] [CrossRef] [Google Scholar]
- Draine, B. T. 2006, ApJ, 636, 1114 [NASA ADS] [CrossRef] [Google Scholar]
- Ducourant, C., Teixeira, R., Périé, J. P., et al. 2005, A&A, 438, 769 [NASA ADS] [CrossRef] [EDP Sciences] [Google Scholar]
- Dutrey, A., Guilloteau, S., & Simon, M. 2003, A&A, 402, 1003 [NASA ADS] [CrossRef] [EDP Sciences] [Google Scholar]
- Duvert, G., Guilloteau, S., Ménard, F., Simon, M., & Dutrey, A. 2000, A&A, 355, 165 [NASA ADS] [Google Scholar]
- Ghez, A. M., Neugebauer, G., & Matthews, K. 1993, AJ, 106, 2005 [NASA ADS] [CrossRef] [Google Scholar]
- Goldsmith, P. F., Heyer, M., Narayanan, G., et al. 2008, ApJ, 680, 428 [NASA ADS] [CrossRef] [Google Scholar]
- Gorti, U., Dullemond, C. P., & Hollenbach, D. 2009, ApJ, 705, 1237 [NASA ADS] [CrossRef] [Google Scholar]
- Guilloteau, S., Dutrey, A., Pety, J., & Gueth, F. 2008, A&A, 478, L31 [NASA ADS] [CrossRef] [EDP Sciences] [Google Scholar]
- Guilloteau, S., Dutrey, A., Piétu, V., & Boehler, Y. 2011, A&A, 529, A105 [NASA ADS] [CrossRef] [EDP Sciences] [Google Scholar]
- Guilloteau, S., Di Folco, E., Dutrey, A., et al. 2013, A&A, 549, A92 [NASA ADS] [CrossRef] [EDP Sciences] [Google Scholar]
- Hartmann, L., Megeath, S. T., Allen, L., et al. 2005, ApJ, 629, 881 [NASA ADS] [CrossRef] [Google Scholar]
- Isella, A., Carpenter, J. M., & Sargent, A. I. 2009, ApJ, 701, 260 [NASA ADS] [CrossRef] [Google Scholar]
- Isella, A., Natta, A., Wilner, D., Carpenter, J. M., & Testi, L. 2010, ApJ, 725, 1735 [NASA ADS] [CrossRef] [Google Scholar]
- Kenyon, S. J., & Hartmann, L. 1995, ApJS, 101, 117 [NASA ADS] [CrossRef] [Google Scholar]
- Kraus, A. L., Ireland, M. J., Martinache, F., & Hillenbrand, L. A. 2011, ApJ, 731, 8 [NASA ADS] [CrossRef] [Google Scholar]
- Leinert, C., Zinnecker, H., Weitzel, N., et al. 1993, A&A, 278, 129 [NASA ADS] [Google Scholar]
- Lissauer, J. J., Marcy, G. W., Rowe, J. F., et al. 2012, ApJ, 750, 112 [NASA ADS] [CrossRef] [Google Scholar]
- Lissauer, J. J., Jontof-Hutter, D., Rowe, J. F., et al. 2013, ApJ, 770, 131 [NASA ADS] [CrossRef] [Google Scholar]
- Moneti, A., & Zinnecker, H. 1991, A&A, 242, 428 [NASA ADS] [Google Scholar]
- Najita, J. R., Strom, S. E., & Muzerolle, J. 2007, MNRAS, 378, 369 [NASA ADS] [CrossRef] [Google Scholar]
- Najita, J. R., Crockett, N., & Carr, J. S. 2008, ApJ, 687, 1168 [NASA ADS] [CrossRef] [Google Scholar]
- Nakajima, T., & Golimowski, D. A. 1995, AJ, 109, 1181 [NASA ADS] [CrossRef] [Google Scholar]
- Owen, J. E., & Clarke, C. J. 2012, MNRAS, 426, L96 [NASA ADS] [CrossRef] [Google Scholar]
- Pérez, L. M., Carpenter, J. M., Chandler, C. J., et al. 2012, ApJ, 760, L17 [NASA ADS] [CrossRef] [Google Scholar]
- Piétu, V., Guilloteau, S., & Dutrey, A. 2005, A&A, 443, 945 [NASA ADS] [CrossRef] [EDP Sciences] [Google Scholar]
- Piétu, V., Dutrey, A., Guilloteau, S., Chapillon, E., & Pety, J. 2006, A&A, 460, L43 [NASA ADS] [CrossRef] [EDP Sciences] [Google Scholar]
- Piétu, V., Dutrey, A., & Guilloteau, S. 2007, A&A, 467, 163 [NASA ADS] [CrossRef] [EDP Sciences] [Google Scholar]
- Ricci, L., Testi, L., Natta, A., et al. 2010, A&A, 512, A15 [NASA ADS] [CrossRef] [EDP Sciences] [Google Scholar]
- Siess, L., Dufour, E., & Forestini, M. 2000, A&A, 358, 593 [Google Scholar]
- White, R. J., & Ghez, A. M. 2001, ApJ, 556, 265 [Google Scholar]
- White, R. J., & Hillenbrand, L. A. 2004, ApJ, 616, 998 [NASA ADS] [CrossRef] [Google Scholar]
- Zhu, Z., Hartmann, L., & Gammie, C. 2010, ApJ, 713, 1143 [NASA ADS] [CrossRef] [Google Scholar]
All Tables
All Figures
|
Fig. 1 Naturally weighted continuum images for all sources. Contour levels are − 3, 3, 6 12, 24, 48, and 96 times the noise level. Noise level (in mJy/beam) is indicated in the upper right corner of each panel. Only CX Tau has a potential secondary source: a 6σ signal (0.7 mJy) is located approximately 3.8′′ NE of CX Tau. Positions are relative to the coordinates in Table 1. |
| In the text | |
|
Fig. 2 Continuum images obtained with robust weighting. Contour levels are − 4, − 2, 2, 4, 8, 16, 32, 64, and 128 times the noise level. Noise level (in mJy/beam) is indicated in the upper right corner of each panel. Crosses indicate the orientation and aspect ratio of the disks derived from model fitting. Positions are relative to the coordinates in Table 1. |
| In the text | |
|
Fig. 3 Deprojected visibility profiles for the sources on a common relative scale, with best-fit profiles superimposed. Red is for the power-law fit, blue for the viscous profile. |
| In the text | |
|
Fig. 4 Left: S/N map of the 13CO 2−1 emission towards CW Tau. The cross indicates the position, orientation and aspect ratio of the continuum disk. Contours are in steps of 2σ, with the zero contour omitted and negative contours dashed. Right: integrated 13CO 2−1 spectrum. |
| In the text | |
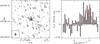 |
Fig. 5 As in Fig. 4 but for CX Tau. |
| In the text | |
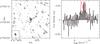 |
Fig. 6 As in Fig. 4 but for DE Tau. |
| In the text | |
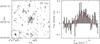 |
Fig. 7 As in Fig. 4 but for DS Tau. |
| In the text | |
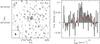 |
Fig. 8 As in Fig. 4 but for SU Aur. |
| In the text | |
|
Fig. 9 Dust emissivity index β as a function of characteristic radius Rc. Sources in blue are from Guilloteau et al. (2011), and in red from this work. |
| In the text | |
|
Fig. 10 Characteristic radius Rc as a function of 230 GHz flux density. Sources in blue are from Guilloteau et al. (2011), and in red from this work. |
| In the text | |
|
Fig. 11 Dust disk radius Rout as a function of the system’s age. |
| In the text | |
|
Fig. 12 Dust disk radius Rout as a function of the product age × mass accretion rate. |
| In the text | |
|
Fig. A.1 Deprojected visibility profiles for the sources on a common relative scale, with best-fit profiles superimposed. Partially self-calibrated version. Red is for the power-law fit, blue for the viscous profile. |
| In the text | |
|
Fig. B.1 χ2 contours as a function of Rout and i for all compact sources (red contours, 1 to 5σ by increasing width), overlaid on the surface density values in gray scale. The surface density contours are 5, 10, 20, 40, 80 and 160 g cm-2 (of dust+gas, assuming a gas-to-dust ratio of 100). The source name is indicated in each panel. |
| In the text | |
Current usage metrics show cumulative count of Article Views (full-text article views including HTML views, PDF and ePub downloads, according to the available data) and Abstracts Views on Vision4Press platform.
Data correspond to usage on the plateform after 2015. The current usage metrics is available 48-96 hours after online publication and is updated daily on week days.
Initial download of the metrics may take a while.