Fig. 2
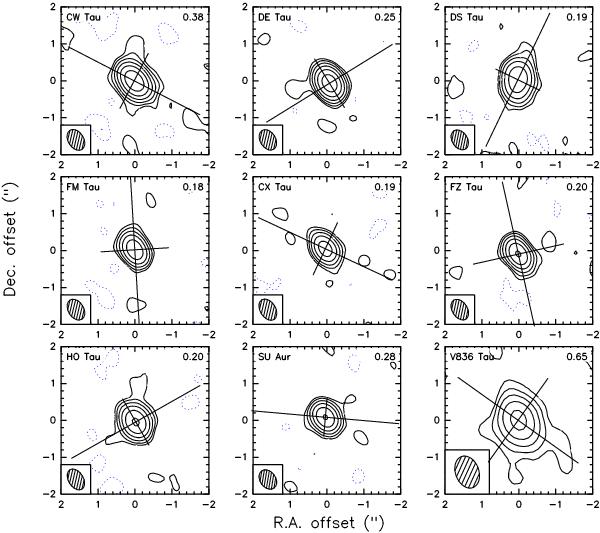
Continuum images obtained with robust weighting. Contour levels are − 4, − 2, 2, 4, 8, 16, 32, 64, and 128 times the noise level. Noise level (in mJy/beam) is indicated in the upper right corner of each panel. Crosses indicate the orientation and aspect ratio of the disks derived from model fitting. Positions are relative to the coordinates in Table 1.
Current usage metrics show cumulative count of Article Views (full-text article views including HTML views, PDF and ePub downloads, according to the available data) and Abstracts Views on Vision4Press platform.
Data correspond to usage on the plateform after 2015. The current usage metrics is available 48-96 hours after online publication and is updated daily on week days.
Initial download of the metrics may take a while.