| Issue |
A&A
Volume 563, March 2014
|
|
|---|---|---|
| Article Number | A53 | |
| Number of page(s) | 14 | |
| Section | Galactic structure, stellar clusters and populations | |
| DOI | https://doi.org/10.1051/0004-6361/201323247 | |
| Published online | 06 March 2014 | |
Stellar substructures in the solar neighbourhood
III. Kinematic group 2 in the Geneva-Copenhagen survey⋆
1 Institute of Theoretical Physics and Astronomy (ITPA), Vilnius University, A. Gostauto 12, 01108 Vilnius, Lithuania
e-mail: renata.zenoviene@tfai.vu.lt; grazina.tautvaisiene@tfai.vu.lt; edita.stonkute@tfai.vu.lt
2 Niels Bohr Institute, Copenhagen University, Juliane Maries Vej 30, 2100 Copenhagen, Denmark
e-mail:birgitta@nbi.ku.dk
Received: 13 December 2013
Accepted: 16 January 2014
Context. From correlations between orbital parameters, several new coherent groups of stars were recently identified in the Galactic disc and suggested to correspond to remnants of disrupted satellites. To reconstruct their origin at least three main observational parameters – kinematics, chemical composition and age – must be known.
Aims. We determine detailed elemental abundances in stars belonging to the so-called Group 2 of the Geneva-Copenhagen Survey and compare the chemical composition with Galactic thin- and thick-disc stars, as well as with the Arcturus and AF06 streams (Arifyanto & Fuchs 2006, A&A, 449, 533). The aim is to search for chemical signatures that might give information about the formation history of this kinematic group of stars.
Methods. High-resolution spectra were obtained with the FIES spectrograph at the Nordic Optical Telescope, La Palma, and were analysed with a differential model atmosphere method. Comparison stars were observed and analysed with the same method.
Results. The average value of [Fe/H] for the 32 stars of Group 2 is − 0.42 ± 0.10 dex. The investigated group consists mainly of two 8- and 12-Gyr-old stellar populations. Abundances of oxygen, α-elements, and r-process-dominated elements are higher than in Galactic thin-disc dwarfs. This elemental abundance pattern has similar characteristics as that of the Galactic thick-disc.
Conclusions. The similarity in chemical composition of stars in Group 2 with that in stars of the thick-disc might suggest that their formation histories are linked. The chemical composition together with the kinematic properties and ages of stars in the stars investigated provides evidence of their common origin and possible relation to an ancient merging event. A gas-rich satellite merger scenario is proposed as the most likely origin. Groups 2 and 3 of the Geneva-Copenhagen Survey might have originated in the same merging event.
Key words: stars: abundances / Galaxy: disk / Galaxy: formation / Galaxy: evolution
Tables 4 and 5 are available in electronic form at http://www.aanda.org
© ESO, 2014
1. Introduction
A combined study of kinematics and chemical composition of stars is one of the most promising tools of research in galaxy formation. The main goal in this field of research is to reconstruct the formation history of our Galaxy, to reveal the origin of the thick disc, and to find remnants of ancient mergers. Large surveys, such as the Geneva Copenhagen Survey (GCS, Nordström et al. 2004), the RAdial Velocity Experiment (RAVE, Steinmetz et al. 2006; Zwitter et al. 2008; Siebert et al. 2011), and the Sloan Extension for Galactic Understanding and Exploration (SEGUE, Yanny et al. 2009), are very good databases for such studies.
Parameters of the programme and comparison stars.
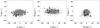 |
Fig. 1 Velocity distribution for all stars in the sample of Holmberg et al. (2009) (plus signs), stars of Group 2 (circles), and the stars investigated (filled circles). |
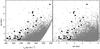 |
Fig. 2 Distribution for the stars in the APL space. Plus signs denote the GCS sample (Holmberg et al. 2009), circles denote Group 2, the filled circles are the stars investigated. Note that the stars investigated as well as all Group 2 stars are distributed in APL space with constant eccentricity. |
In this series of papers, we focus on the detailed chemical composition study of recently identified stellar kinematic groups that were suggested to belong to remnants of ancient merger events in our Galaxy. The GCS Group 3 was investigated recently by Stonkutė et al. (2012, 2013, hereafter Paper I and Paper II), while here we present our results of analysis of the GCS Group 2. These kinematic stellar groups were identified in the GCS catalogue by Helmi et al. (2006). These authors analysed numerical simulations of the disruption of satellite galaxies and found substructures in the space defined by apocentre, pericentre, and z-angular momentum (the so called APL-space). Stars released in different perigalactic passages of the merging galaxy have slightly different orbital properties, and hence are located in several smaller lumps in the APL-space. However, these lumps are located along a segment of constant eccentricity, thereby permitting the assessment of a common origin. Such substructures in the APL-space remain coherent for many Gyr, well after the mergers have fully mixed. The APL-space for the GCS catalogue shows large amounts of substructure. The most prominent structures are related to the superclusters Hyades-Pleiades, Sirius and Hercules, and are most likely generated by dynamical perturbations induced by the spiral arms and the Galactic bar. These structures are composed of stars on disc-like orbits with relatively low eccentricity. However, the detailed statistical analysis of the APL-space revealed about ten other overdensities at significance levels higher than 99%. These overdensities were located along two to three segments of constant eccentricity, as predicted for substructures that are the result of minor mergers. There were 274 stars in this region of the APL-space, which is delimited by eccentricity 0.3 ≤ ϵ < 0.5. The metallicity distribution of the stars in this overdense region of the APL-space varied with eccentricity in a discontinuous fashion. This allowed the separation of these stars into three Groups. These three groups of stars are dissimilar not only in their metallicity distribution, but also have different kinematics in the vertical (z) direction. The Group 1 velocity dispersion has σz about 28 km s-1, that of Group 2 about 39 km s-1, and that of Group 3 about 52 km s-1. The groups also have distinct age distributions. Group 2 contains 86 stars; for 32 of them we determine the detailed chemical composition in this work.
2. Observations and analysis
A list of the observed stars and some of their parameters (taken from the catalogue of Holmberg et al. 2009 and Simbad) are presented in Table 1. Thirty-two stars of Group 2 and seven comparison stars (thin-disc dwarfs) were observed.
In Fig. 1 we show the Galactic disc stars from Holmberg et al. (2009). Stars belonging to Group 2 in Helmi et al. (2006) are marked with open and filled circles (the latter are used to mark stars investigated in our work). The stars belonging to Group 2 have a different distribution in the velocity space than other stars of the Galactic disc. In Fig. 2 the stars are shown in the APL-space. The Toomre diagram of all stars of Group 2 and those investigated in this work are presented in Fig. 3.
Spectra of high-resolving power (R ≈ 68 000) in the wavelength range of 3680–7270 Å were obtained at the Nordic Optical Telescope with the FIES spectrograph during July 2008. All spectra were exposed to reach a signal-to-noise ratio higher than 100. Reductions of CCD images were made with the FIES pipeline FIEStool, which performs a complete reduction: calculation of reference frame, bias and scattering subtraction, flat-field dividing, wavelength calibration and other procedures1. Several examples of observed stellar spectra are presented in Fig. 4.
The spectra were analysed using the differential model atmosphere technique described in Papers I and II. Here we only recall some details. The Eqwidth and BSYN program packages, developed at the Uppsala Astronomical Observatory, were used to carry out the calculation of abundances from measured equivalent widths and synthetic spectra, respectively. A set of plane-parallel, line-blanketed, constant-flux LTE model atmospheres (Gustafsson et al. 2008) were taken from the MARCS stellar model atmosphere and flux library2.
The Vienna Atomic Line Data Base (VALD, Piskunov et al. 1995) was used in preparing input data for the calculations. Atomic oscillator strengths for the main spectral lines analysed in this study were taken from an inverse solar spectrum analysis performed in Kiev (Gurtovenko & Kostyk 1989).
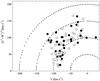 |
Fig. 3 Toomre diagram of all stars of Group 2 (circles) and those investigated in this work (filled circles). Dotted lines indicate constant values of total space velocity in steps of 50 km s-1. |
Initial values of the effective temperatures for the programme stars were taken from Holmberg et al. (2009) and were then carefully checked and corrected for, if needed, by forcing the Fe i lines to yield no dependency of the iron abundance on the excitation potential by changing the model effective temperature. We used the ionisation equilibrium method to find surface gravities of the programme stars by forcing neutral and ionised iron lines to yield the same iron abundances. Microturbulence velocity values corresponding to the lowest line-to-line Fe i abundance scattering were chosen as correct values. We determined the abundance of oxygen, yttrium, zirconium, barium, lanthanum, cerium, praseodymium, neodymium, samarium and europium with the spectral synthesis method. Several fits of the synthetic line profiles to the observed spectra are shown in Figs. 5–8. Atomic parameters of lines in the intervals of spectral syntheses were compiled from the VALD database. All log gf values were calibrated to fit to the solar spectrum by Kurucz (2005) with solar abundances from Grevesse & Sauval (2000). Hyperfine structures and isotope shifts were taken into account as appropriate. Abundances of other chemical elements were determined using equivalent widths of their lines. Abundances of Na and Mg were determined with non-local thermodynamical equilibrium (NLTE) taken into account. The equivalent widths of the lines were measured by fitting a Gaussian profile using the 4a software package (Ilyin 2000).
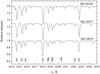 |
Fig. 4 Samples of stellar spectra of several programme stars. An offset of 0.5 in relative flux is applied for clarity. |
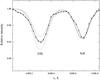 |
Fig. 5 Fit to the forbidden [O i] line at 6300.3 Å in the programme star HD 12782. The observed spectrum is shown as a solid line with black dots. The synthetic spectra with [O/Fe] = 0.52 ± 0.1 are shown as dotted lines. |
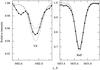 |
Fig. 6 Synthetic spectrum fit to the yttrium line at 5402 Å in the observed spectrum of HD 21543 (left panel) and to the barium line at 5853 Å in the observed spectrum of HD 224817. The observed spectra are shown by solid lines with dots. The dotted lines are synthetic spectra with [Y/Fe] = 0.01 ± 0.1 and with [Ba/Fe] = −0.10 ± 0.1, respectively. |
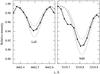 |
Fig. 7 Synthetic spectrum fit to the lanthanum line at 4662 Å in the observed spectrum of HD 143291 (left panel) and to the neodymium line at 5319 Å in the observed spectrum of HD 24156 (right panel). The observed spectra are shown by solid lines with dots. The dotted lines are synthetic spectra with [La/Fe] = 0.05 ± 0.1 and [Nd/Fe] = 0.12 ± 0.1, respectively. |
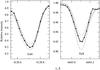 |
Fig. 8 Synthetic spectrum fit to the europium lines at 4129 Å (left) and 6645 Å (right). The observed spectrum for the programme star HD 12782 is shown as a solid line with dots. The dotted lines are synthetic spectra with [Eu/Fe] = 0.40 ± 0.1 and [Eu/Fe] = 0.45 ± 0.1, respectively for these two lines. |
The uncertainties in abundances are due to several sources: uncertainties caused by analysis of individual lines, including random errors of atomic data and continuum placement and uncertainties in the stellar parameters. The sensitivity of the abundance estimates to changes in the atmospheric parameters by the assumed errors3Δ[El/H] are illustrated for the star HD 10519 (Table 2). Clearly, possible parameter errors do not affect the abundances seriously; the element-to-iron ratios, which we use in our discussion, are even less sensitive.
The scatter of the deduced abundances from different spectral lines σ gives an estimate of the uncertainty due to the random errors. The mean value of σ is 0.06 dex, thus the uncertainties in the derived abundances that are the result of random errors amount to approximately this value.
Effects on derived abundances resulting from model changes for the star HD 10519.
Effective temperatures for all stars investigated here are also available in Holmberg et al. (2009) and Casagrande et al. (2011). Casagrande et al. (2011) provided astrophysical parameters for the Geneva-Copenhagen survey by applying the infrared flux method to determine the effective temperature. In comparison to Holmberg et al. (2009), stars in the catalogue of Casagrande et al. (2011) are on average 100 K hotter. For the stars investigated here, our spectroscopic temperatures are on average only 10 ± 60 K hotter than in Holmberg et al. (2009) and 60 ± 80 K cooler than in Casagrande et al. (2011). [Fe/H] values for all investigated stars are available in Holmberg et al. (2009) as well as in Casagrande et al. (2011). A comparison between Holmberg et al. (2009) and Casagrande et al. (2011) shows that the latter gives [Fe/H] values that are more metal-rich on average by 0.1 dex. For our programme stars we obtain a difference of 0.1 ± 0.1 dex in comparison with Holmberg et al. (2009) and no systematic difference, but a scatter of 0.1 dex in comparison with Casagrande et al. (2011). The same result was found from comparing the atmospheric parameters determined for Group 3 stars in our Paper I.
Some stars from our sample were previously investigated by other authors. In Table 3 we present a comparison with results by Reddy et al. (2006), Mashonkina et al. (2007), and Ramírez et al. (2007), who investigated several stars in common with our work. Five thin-disc stars that we investigated in our work for a comparison have been analysed previously by Edvardsson et al. (1993), and two stars have been studied by Bensby et al. (2005). Slight differences in the log g values lie within the errors of uncertainties and are caused mainly by differences in the applied determination methods. In our work we see that titanium and zirconium abundances determined using both neutral and ionised lines agree well and confirm the log g values determined using iron lines. Overall, our [El/Fe] for the stars in common agree very well with those in other studies.
Comparison of Group 2 with previous studies.
3. Results and discussion
The atmospheric parameters Teff, log g, vt, [Fe/H] and abundances of 21 chemical elements relative to iron [El/Fe] of the programme and comparison stars are presented in Tables 4 and 5. The number of lines and the line-to-line scatter (σ) are presented as well.
The metallicities of Group 2 stars lie in quite a narrow interval, with a mean of [Fe/H] = −0.42 ± 0.10. Abundances of other chemical elements are quite homogeneous and show similar overabundances of α-elements and r-process-dominated chemical elements with respect to thin-disc stars, as was also found for the stars of CGS Group 3. However, two stars (HD 200580 and HD 224817) have abundances of these elements similar to the thin-disc stars of the same metallicity. According to their element-to-iron ratios, these two stars might not belong to Group 2. However, their ages (~8 and 12 Gyr, respectively) as presented in Sect. 3.1 seem pretty old and similar to those of other member stars of Group 2. Their kinematic parameters are also similar to those of other stars in Group 2, therefore we have only one argument for detracting a Group 2 membership from these two stars.
The results are graphically displayed in Figs. 9 and 10. We display elemental abundance ratios of Group 2 stars together with data of thin-disc stars investigated in this work and in Papers I and II, as well as with results taken from thin-disc studies (Edvardsson et al. 1993; Gratton & Sneden 1994; Koch & Edvardsson 2002; Bensby et al. 2005; Reddy et al. 2006; Zhang & Zhao 2006; Brewer & Carney 2006; Mashonkina et al. 2007; and Mishenina et al. 2013). The chemical evolution models of the thin-disc were taken from Pagel & Tautvaišienė (1995, 1997). The thin-disc stars from Edvardsson et al. (1993) and Zhang & Zhao (2006) were selected by using the membership probability evaluation method described by Trevisan et al. (2011), since their lists contained stars of other Galactic components as well. The same kinematical approach in assigning thin-disc membership was used in Bensby et al. (2005) and Reddy et al. (2006), which means that the thin-disc stars used for the comparison are uniform in that respect.
Abundances of α-elements and r-process-dominated elements (particularly of Eu, Sm, and Pr) in the investigated Group 2 stars are higher than those of the Galactic thin-disc dwarfs investigated in this work and other studies. We found similar overabundances at the corresponding metallicity in stars of Group 3 as well.
This pattern of elemental ratios is exhibited by the thick-disc stars. In Table 6 we present a comparison of mean [El/Fe] ratios calculated for stars of Group 2 and thick-disc stars at the same metallicity interval − 0.6 < [Fe/H] < − 0.2. Twenty-one stars in this metallicity interval were investigated by Bensby et al. (2005), 38 stars by Reddy et al. (2006), 11 stars by Mashonkina et al. (2007), and 7 stars by Mishenina et al. (2013). When comparing oxygen abundances, we did not use the results reported by Reddy et al. (2006) because they investigated the O i line, while we studied [O i] and neither did we use the results reported by Mishenina et al. (2013) because only three thick-disc stars fall in the corresponding metallicity interval. The studies by Mashonkina et al. (2007) and Mishenina et al. (2013) were included in the comparison to enlarge the information on neutron capture elements. The average values of α-element abundances included Mg, Si, and Ca. Titanium was excluded because this element was not determined in one of the studies (Mishenina et al. 2013). The comparison shows that the deviations do not exceed the uncertainties.
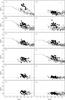 |
Fig. 9 [El/Fe] ratio as a function of [Fe/H] in the investigated stars of Group 2 (filled circles) and comparison stars analysed in this work and Paper I (open circles). The data for the Milky Way thin-disc dwarfs were taken from Edvardsson et al. (1993, plus signs), Bensby et al. (2005, stars), Reddy et al. (2006, squares), and Zhang & Zhao (2006, triangles). Solid lines are Galactic thin-disc chemical evolution models presented by Pagel & Tautvaišienė (1995). Average uncertainties are shown in the box for Na. |
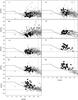 |
Fig. 10 [El/Fe] ratio as a function of [Fe/H] in the investigated stars of Group 2 (filled circles) and comparison stars analysed in this work and Paper II (open circles). The data for the Milky Way thin-disc dwarfs were taken from Edvardsson et al. (1993, plus signs), Gratton & Sneden (1994, triangles), Koch & Edvardsson (2002, upside down triangles), Bensby et al. (2005, stars), Reddy et al. (2006, 2003, squares), Brewer & Carney (2006, diamonds), Mashonkina et al. (2007, crosses), and Mishenina et al. (2013, dots). The Galactic thin-disc chemical evolution model is shown as a solid line (Pagel & Tautvaišienė, 1997). Average uncertainties are shown in the box for Zr. |
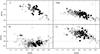 |
Fig. 11 [El/Fe] ratio as a function of [Fe/H] in the investigated stars of Group 2 (filled circles) and Group 3 (thick squares, Papers I and II). The data for the Milky Way thick-disc stars were taken from Mishenina et al. (2013, triangles), Mashonkina et al. (2007, crosses), Reddy et al. (2006, squares), and Bensby et al. (2005, stars). The averaged values for alpha-elements consist of Mg, Si, and Ca abundances. |
Figure 11 displays the comparison of [El/Fe] ratios for some chemical elements between individual stars in Groups 2 and 3 and the thick-disc stars of the above-mentioned studies. For the comparison we selected oxygen, the averaged values for the alpha elements Mg, Si, and Ca, and the s- and r-process-dominated elements barium and europium, respectively. Stars of the kinematic groups and of the thick-disc have a very similar chemical composition. To reveal some possible tiny differences, both types of stars should be investigated using an identical method. However, as we outlined in Paper I for Group 3, the similar chemical composition of stars in Group 2 and the thick-disc stars might also suggest that their formation histories are linked.
3.1. Age
Group 2 is characterised by an interesting feature related to the age distribution of its stars. According to Helmi et al. (2006), the stars fall into three populations: 15% of the stars are 8 Gyr old, 36% are 12 Gyr old, and 49% are 16 Gyr old. The ages were later redetermined by Holmberg et al. (2009) and Casagrande et al. (2011). Because we redetermined the effective temperatures and metallicities using high-resolution spectra, we revisited the age determinations as well.
For the age determination we used the method by Jørgensen & Lindegren (2005) which was used previously in CGS studies (Helmi et al. 2006; Holmberg et al. 2009). This method and other similar Bayesian methods are currently the most common way to determine ages for larger stellar samples. This method with Bayesian probability functions gives a better understanding of how accurate the ages are. For the age determination of Group 2 stars we took into account the α/Fe overabundance of 0.2 dex. The new age evaluations together with lower and upper age limits are presented in Table 7. Previously determined ages from Holmberg et al. (2009) and Casagrande et al. (2011) are presented as well.
Figure 12 shows the investigated stars of Group 2 with our spectroscopic effective temperatures and absolute magnitudes Mv, taken from Holmberg et al. (2009), in a Hertzsprung-Russell (HR) diagram. The isochrones enhanced by α/Fe ~ 0.2 were taken from Bressan et al. (2012). The overall features of stars in the diagram are well reproduced by isochrones of two ages. The more metal-abundant stars fit the 8 Gyr isochrone quite well, while more metal-deficient stars fit the 12 Gyr isochrone. Most of the stars for which older or younger ages were determined also fit these two age populations because these stars belong to the main sequence and determining their age accurately is problematic. As we can see from Fig. 12, the stars HD 37739, HD 38767, and HD 152123 are certainly younger (2.5 Gyr ≤ age ≤ 5 Gyr). In the HR diagram, they lie higher than the turn-off luminosity of the 8 Gyr isochrone. It seems that a subgroup of about 15 such young main sequence stars can be separated from 86 Group 2 stars. A detailed chemical composition study of all these stars might be useful. A chemical composition pattern of these young stars investigated in our work is similar to the rest of the Group 2 stars.
3.2. Origin
The similar chemical composition pattern of stars in GCS Groups 2 and 3 (Papers I and II) indicates that these kinematic groups share a similar origin. The similarity in chemical composition of stars in these two kinematic groups and in the thick-disc of the Galaxy suggests that the formation histories of these groups and the thick-disc might be linked as well. Thus it is natural to determine which of the currently available thick-disc formation scenarios is most suitable. The kinematic properties of Groups 2 and 3 fit a gas-rich satellite merger scenario well (Brook et al. 2004, 2005; Dierickx et al. 2010; Wilson et al. 2011; Di Matteo et al. 2011, and references therein). Within this specific scenario, the eccentricities of accreted stars peak at about 0.3 < ϵ < 0.5 (Sales et al. 2009), which is exactly the characteristics of the investigated CGS groups. This scenario fits the thick-disc star eccentricity distribution better than the accretion, heating, or migration scenarios (Dierickx et al. 2010).
Dierickx et al. (2010) analysed the eccentricity distribution of thick-disc stars that has recently been proposed as a diagnostic to differentiate between these mechanisms (Sales et al. 2009). Using SDSS data release 7, they have assembled a sample of 31.535 G-dwarfs with six-dimensional phase-space information and metallicities and have derived their orbital eccentricities. They found that the observed eccentricity distribution is inconsistent with that predicted by orbital migration alone. Moreover, the thick-disc cannot be produced predominantly through heating of a pre-existing thin-disc, since this model predicts more high-eccentricity stars than observed. According to Dierickx et al. (2010), the observed eccentricity distribution fits a gas-rich merger scenario well, where most thick-disc stars were born in situ.
Comparison with thick-disc studies.
Ages determined in this work and other studies.
In the gas-rich satellite merger scenario, a distribution of stellar eccentricities peak around ϵ = 0.25, with a tail towards higher values belonging mostly to stars originally formed in satellite galaxies. The group of stars investigated in our work fits this model with a mean eccentricity value of 0.4. This scenario is also supported by the RAVE survey data analysis made by Wilson et al. (2011) and the numerical simulations by Di Matteo et al. (2011). In this scenario, Groups 2 and 3 can be explained as remnants of stars originally formed in a merging satellite. These kinematic star groups might belong to the same satellite galaxy. Helmi et al. (2006) showed that in numerical simulations of the disruption of a satellite galaxy that falls into its parent galaxy, the satellite debris can end up in several cold star streams with roughly the same characteristic eccentricities of their orbits. To conclude about the origin of the kinematic CGS groups, we need more observational and theoretical investigations of stellar kinematic groups and the thick-disc. In the following subsection we briefly overview the available high-resolution spectral analyses of two other kinematic groups of the Galaxy.
3.3. Comparison with the Arcturus and AF06 streams
Finally, we discuss Group 2 in the context of several other Galactic substructures. Helmi et al. (2006) briefly mentioned a seeming overlap between Group 2 and the Arcturus stream (Navarro et al. 2004) in their kinematics and metallicities. Our study of Group 2 and the high-resolution spectroscopic analysis available for the Arcturus stream (Ramya et al. 2012) allow us to compare the detailed chemical composition in these two substructures. To this comparison, we added the so-called stellar stream AF06, which was discovered by Arifyanto & Fuchs (2006). According to the discoverers, AF06 possibly resembles the Arcturus stream and probably has an extragalactic origin. A chemical composition of AF06 stars was also investigated by Ramya et al. (2012).
Figure 13 displays the comparison of [El/Fe] ratios for alpha-elements between individual stars in Group 2 and the Arcturus and AF06 streams. The averaged values for alpha-elements consist of Mg, Si, Ca, and Ti abundances. Simple second-order polynomial fits were applied to the available 18 stars of the Artcturus stream, to 26 stars of the AF06 stream, and to 32 stars of Group 2, which revealed slight systematic differences between the element-to-iron ratios in these stellar groups. While Group 2 and AF06 stars differ only by about 0.05 dex, the Arcturus stars lie by about 0.1 dex lower than the Group 2 stars. Consequently, the detailed chemical composition of the Group 2 and Arcturus stream stars is different. We disagree with Ramya et al. (2012), who reported that the Arcturus group overlaps with the properties of the local field thick-disc stars. In our understanding, the chemical composition of stars attributed to the Arcturus stream, determined in the work by Ramya et al. (2012), much more resembles the abundances of the thin-disc than those of the thick-disc stars.
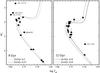 |
Fig. 12 HR diagrams of the Group 2 stars. Isochrones are taken from Bressan et al. (2012). The filled circles correspond to the stars investigated with the spectroscopic effective temperatures. Isochrones are with [α/Fe] = 0.2. |
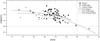 |
Fig. 13 [Alpha/Fe] ratio as a function of [Fe/H] in the investigated stars of Group 2 (filled circles), in the Arcturus stream (plus signs), and in the AF06 stream (diamonds). The data for Arcturus and AF06 streams were taken from Ramya et al. (2012). The averaged values for alpha-elements consist of Mg, Si, Ca, and Ti abundances. |
The origin of the Arcturus stream has been debated for years. The identification of the Arcturus stream member stars has begun in 1971 and still continues (Eggen 1971, 1996, 1998; Arifyanto & Fuchs 2006; Gilmore et al. 2002; Wyse et al. 2006; Bensby et al. 2014, and references therein). Navarro et al. (2004) analysed the group of stars associated kinematically with Arcturus and confirmed that they constitute a peculiar grouping of metal-poor stars with a similar apocentric radius, a common angular momentum, and distinct metal abundance patterns. These properties are consistent with those expected for a group of stars originating from the debris of a disrupted satellite. It was also noticed that its angular momentum appears to be too low to arise from dynamical perturbations induced by the Galactic bar. More recently, Gardner & Flynn (2010) and Monari et al. (2013) showed that the Galactic long bar may produce a kinematic feature in velocity space with the same parameters as occupied by the Arcturus moving group. However, if the Arcturus group indeed has thick-disc kinematics and thin-disc abundances, its peculiarity and possible extragalactic origin remain an unsolved question.
For the AF06 stream, our comparison shows that the chemical composition of this stream is quite similar to that of Group 2. The AF06 stream was identified by Arifyanto & Fuchs (2006) analysing the fine structure of the phase space distribution function of nearby subdwarfs using data extracted from various catalogues.
It is worth pointing out that currently observed Galactic satellites, which are often referred to as representatives of the building blocks of our Galaxy, contain systematically lower [α/Fe] ratios at corresponding metallicities than observed in these kinematic groups as well as in field stars of the Galaxy, and stars in each dwarf galaxy also show different abundance patterns (see e.g. Geisler et al. 2007; Tautvaišienė et al. 2009; Tolstoy et al. 2009, and references therein). Moreover, photometric and spectroscopic studies of dwarf spheroidal galaxies show that they contain little or no gas and no recent star formation (e.g. Smecker-Hane et al. 1994; Tolstoy et al. 2003; Venn et al. 2004). Various solutions have been proposed to solve these problems (Robertson et al. 2005; Bullock & Johnston 2005; Font et al. 2006aa,b; Kirby et al. 2008, 2011; Frebel et al. 2010; Tafelmeyer et al. 2010; Smith et al. 2012; Belokurov 2013), it was even proposed that the present-day Local Group dwarf galaxies may not be the generic galactic building blocks (Unavane et al. 1996). This means that there is certainly much more to discover about our Milky Way and studies should be continued. We plan to analyse a chemical composition of stars in Group 1 of the Geneva-Copenhagen survey. This group is the most metal-abundant of the new kinematic groups identified in CGS.
4. Conclusions
We measured abundances of 22 chemical elements from high-resolution spectra in 32 stars belonging to Group 2 of the Geneva-Copenhagen survey. This kinematically identified group of stars was suggested to be a remnant of a disrupted satellite galaxy. Our main goal was to investigate the chemical composition of the stars within the group and to compare them with Galactic disc stars.
Our study of 32 stars in Group 2 shows the following:
-
1.
The metallicities of the investigated starsin Group 2 are in the range−0.16 ≥ [Fe/H] ≥ −0.60. The average [Fe/H] value is −0.42 ± 0.10 dex.
-
2.
All programme stars have higher abundances in oxygen, α-elements, and r-process-dominated chemical elements than Galactic thin-disc dwarfs and the Galactic evolution model. This abundance pattern has similar characteristics as the Galactic thick disc and Group 3 of the Geneva-Copenhagen Survey.
-
3.
The abundances of iron-group chemical elements and elements produced mainly by the s-process are similar to those in the Galactic thin-disc dwarfs of the same metallicity.
-
4.
The similarity of the chemical composition in Group 2 and thick-disc stars might suggest that their formation histories are linked.
-
5.
Groups 2 and 3 might originate from the same satellite galaxy.
-
6.
Investigated Group 2 stars consist mainly of two 8- and 12-Gyr-old populations.
-
7.
The chemical composition together with the kinematic properties and ages of stars in the investigated Group 2 of the Geneva-Copenhagen survey support a gas-rich satellite merger scenario as the most probable origin for Group 2.
Online material
Main atmospheric parameters and elemental abundances of the programme and comparison stars.
Elemental abundances of neutron-capture elements for the programme and comparison stars.
Acknowledgments
The data are based on observations made with the Nordic Optical Telescope, operated on the island of La Palma jointly by Denmark, Finland, Iceland, Norway, and Sweden, in the Spanish Observatorio del Roque de los Muchachos of the Instituto de Astrofísica de Canarias. The research leading to these results has received funding from the European Community’s Seventh Framework Programme (FP7/2007-2013) under grant agreement number RG226604 (OPTICON). B.N. acknowledges support from the Danish Research council and the Carlsberg Foundation. We are grateful to J. Holmberg for help with age calculations. This research has made use of Simbad, VALD and NASA ADS databases. We thank the anonymous referee for insightful questions and comments.
References
- Arifyanto, M. I., & Fuchs, B. 2006, A&A, 449, 533 [NASA ADS] [CrossRef] [EDP Sciences] [Google Scholar]
- Belokurov, V. 2013, New A Rev., 57, 100 [Google Scholar]
- Bensby, T., Feltzing, S., Lundström, I., & Ilyin, I. 2005, A&A, 433, 185 [NASA ADS] [CrossRef] [EDP Sciences] [Google Scholar]
- Bensby, T., Feltzing, S., & Oey, M. S. 2014, A&A, 562, A71 [NASA ADS] [CrossRef] [EDP Sciences] [Google Scholar]
- Bressan, A., Marigo, P., Girardi, L., et al. 2012, MNRAS, 427, 127 [NASA ADS] [CrossRef] [Google Scholar]
- Brewer, M.-M., & Carney, B. W. 2006, AJ, 131, 431 [NASA ADS] [CrossRef] [Google Scholar]
- Brook, C. B., Kawata, D., Gibson, B. K., & Freeman, K. C. 2004, ApJ, 612, 894 [NASA ADS] [CrossRef] [Google Scholar]
- Brook, C. B., Gibson, B. K., Martel, H., & Kawata, D. 2005, ApJ, 630, 298 [NASA ADS] [CrossRef] [Google Scholar]
- Bullock, J. S., & Johnston, K. V. 2005, ApJ, 635, 931 [NASA ADS] [CrossRef] [Google Scholar]
- Casagrande, L., Schönrich, R., Asplund, M., et al. 2011, A&A, 530, A138 [NASA ADS] [CrossRef] [EDP Sciences] [Google Scholar]
- Di Matteo, P., Lehnert, M. D., Qu, Y., & van Driel, W. 2011, A&A, 525, L3 [NASA ADS] [CrossRef] [EDP Sciences] [Google Scholar]
- Dierickx, M., Klement, R., Rix, H.-W., & Liu, C. 2010, ApJ, 725, L186 [NASA ADS] [CrossRef] [Google Scholar]
- Edvardsson, B., Andersen, J., Gustafsson, B., et al. 1993, A&A, 275, 101 [NASA ADS] [Google Scholar]
- Eggen, O. J. 1971, PASP, 83, 271 [NASA ADS] [CrossRef] [Google Scholar]
- Eggen, O. J. 1996, AJ, 112, 1595 [NASA ADS] [CrossRef] [Google Scholar]
- Eggen, O. J. 1998, AJ, 115, 2397 [NASA ADS] [CrossRef] [Google Scholar]
- Font, A. S., Johnston, K. V., Bullock, J. S., & Robertson, B. E. 2006a, ApJ, 638, 585 [Google Scholar]
- Font, A. S., Johnston, K. V., Bullock, J. S., & Robertson, B. E. 2006b, ApJ, 646, 886 [NASA ADS] [CrossRef] [Google Scholar]
- Frebel, A., Simon, J. D., Geha, M., & Willman, B. 2010, ApJ, 708, 560 [NASA ADS] [CrossRef] [Google Scholar]
- Gardner, E., & Flynn, C. 2010, MNRAS, 405, 545 [NASA ADS] [Google Scholar]
- Geisler, D., Wallerstein, G., Smith, V. V., & Casetti-Dinescu, D. I. 2007, PASP, 119, 939 [NASA ADS] [CrossRef] [Google Scholar]
- Gilmore, G., Wyse, R. F. G., & Norris, J. E. 2002, ApJ, 574, L39 [NASA ADS] [CrossRef] [Google Scholar]
- Gratton, R. G., & Sneden, C. 1994, A&A, 287, 927 [NASA ADS] [Google Scholar]
- Grevesse, N., & Sauval, A. J. 2000, Proc. Int. Symp. Origin of Elements in the Solar System, Implications of Post-1957 Observations, ed. O. Manuel (Boston, Dordrecht: Kluwer Academic/Plenum Publishers), 261 [Google Scholar]
- Gurtovenko, E. A., & Kostyk, R. I. 1989, in Izdatel’stvo Naukova Dumka, Kiev [Google Scholar]
- Gustafsson, B., Edvardsson, B., Eriksson, K., et al. 2008, A&A, 486, 951 [NASA ADS] [CrossRef] [EDP Sciences] [Google Scholar]
- Helmi, A., Navarro, J. F., Nordström, B., et al. 2006, MNRAS, 365, 1309 [NASA ADS] [CrossRef] [Google Scholar]
- Holmberg, J., Nordström, B., & Andersen, J. 2007, A&A, 475, 519 [NASA ADS] [CrossRef] [EDP Sciences] [MathSciNet] [Google Scholar]
- Holmberg, J., Nordström, B., & Andersen, J. 2009, A&A, 501, 941 [NASA ADS] [CrossRef] [EDP Sciences] [Google Scholar]
- Ilyin, I. V. 2000, Ph.D. dissertation, Univ. Oulu, Finland [Google Scholar]
- Jørgensen, B. R., & Lindegren, L. 2005, A&A, 436, 127 [NASA ADS] [CrossRef] [EDP Sciences] [Google Scholar]
- Kirby, E. N., Simon, J. D., Geha, M., Guhathakurta, P., & Frebel, A. 2008, ApJ, 685, L43 [NASA ADS] [CrossRef] [Google Scholar]
- Kirby, E. N., Lanfranchi, G. A., Simon, J. D., Cohen, J. G., & Guhathakurta, P. 2011, ApJ, 727, 78 [NASA ADS] [CrossRef] [Google Scholar]
- Koch, A., & Edvardsson, B. 2002, A&A, 381, 500 [NASA ADS] [CrossRef] [EDP Sciences] [Google Scholar]
- Kurucz, R. L. 2005, Mem. Soc. Astron. It. Suppl., 8, 189 [Google Scholar]
- Mashonkina, L. I., Vinogradova, A. B., Ptitsyn, D. A., Khokhlova, V. S., & Chernetsova, T. A. 2007, Astron. Rep., 51, 903 [NASA ADS] [CrossRef] [Google Scholar]
- Mishenina, T. V., Pignatari, M., Korotin, S. A., et al. 2013, A&A, 552, A128 [NASA ADS] [CrossRef] [EDP Sciences] [Google Scholar]
- Monari, G., Antoja, T., & Helmi, A. 2013, A&A, submitted [arXiv:1306.2632] [Google Scholar]
- Navarro, J. F., Helmi, A., & Freeman, K. C. 2004, ApJ, 601, L43 [NASA ADS] [CrossRef] [Google Scholar]
- Nordström, B., Mayor, M., Andersen, J., et al. 2004, A&A, 418, 989 [NASA ADS] [CrossRef] [EDP Sciences] [Google Scholar]
- Pagel, B. E. J., & Tautvaišienė, G. 1995, MNRAS, 276, 505 [NASA ADS] [CrossRef] [Google Scholar]
- Pagel, B. E. J., & Tautvaišienė, G. 1997, MNRAS, 288, 108 [NASA ADS] [CrossRef] [Google Scholar]
- Piskunov, N. E., Kupka, F., Ryabchikova, T. A., Weiss, W. W., & Jeffery, C. S. 1995, A&AS, 112, 525 [NASA ADS] [Google Scholar]
- Ramírez, I., Allen de Prieto, C., & Lambert, D. L. 2007, A&A, 465, 271 [NASA ADS] [CrossRef] [EDP Sciences] [Google Scholar]
- Ramya, P., Reddy, B. E., & Lambert, D. L. 2012, MNRAS, 425, 3188 [NASA ADS] [CrossRef] [Google Scholar]
- Reddy, B. E., Tomkin, J., Lambert, D. L., & Allen de Prieto, C. 2003, MNRAS, 340, 304 [NASA ADS] [CrossRef] [Google Scholar]
- Reddy, B. E., Lambert, D. L., & Allen de Prieto, C. 2006, MNRAS, 367, 1329 [NASA ADS] [CrossRef] [Google Scholar]
- Robertson, B., Bullock, J. S., Font, A. S., Johnston, K. V., & Hernquist, L. 2005, ApJ, 632, 872 [NASA ADS] [CrossRef] [Google Scholar]
- Sales, L. V., Helmi, A., Abadi, M. G., et al. 2009, MNRAS, 400, L61 [NASA ADS] [CrossRef] [Google Scholar]
- Siebert, A., Williams, M. E. K., Siviero, A., et al. 2011, AJ, 141, 187 [NASA ADS] [CrossRef] [Google Scholar]
- Smecker-Hane, T. A., Stetson, P. B., Hesser, J. E., & Lehnert, M. D. 1994, AJ, 108, 507 [NASA ADS] [CrossRef] [Google Scholar]
- Smith, M. C., Okamoto, S., Yuan, H.-B., & Liu, X.-W. 2012, Res. Astron. Astrophys., 12, 1021 [NASA ADS] [CrossRef] [Google Scholar]
- Steinmetz, M., Zwitter, T., Siebert, A., et al. 2006, AJ, 132, 1645 [NASA ADS] [CrossRef] [Google Scholar]
- Stonkutė, E., Tautvaišienė, G., Nordström, B., & Ženovienė, R. 2012, A&A, 541, A157 (Paper I) [NASA ADS] [CrossRef] [EDP Sciences] [Google Scholar]
- Stonkutė, E., Tautvaišienė, G., Nordström, B., & Ženovienė, R. 2013, A&A, 555, A6 (Paper II) [NASA ADS] [CrossRef] [EDP Sciences] [Google Scholar]
- Tafelmeyer, M., Jablonka, P., Hill, V., et al. 2010, A&A, 524, A58 [NASA ADS] [CrossRef] [EDP Sciences] [Google Scholar]
- Tautvaišienė, G., Geisler, D., & Wallerstein, G. 2009, Science with the VLT in the ELT Era, Astrophys. Space Sci. Proc. (Springer), 205 [Google Scholar]
- Tolstoy, E., Venn, K. A., Shetrone, M., et al. 2003, AJ, 125, 707 [NASA ADS] [CrossRef] [Google Scholar]
- Tolstoy, E., Hill, V., & Tosi, M. 2009, ARA&A, 47, 371 [NASA ADS] [CrossRef] [Google Scholar]
- Trevisan, M., Barbuy, B., Eriksson, K., et al. 2011, A&A, 535, A42 [NASA ADS] [CrossRef] [EDP Sciences] [Google Scholar]
- Unavane, M., Wyse, R. F. G., & Gilmore, G. 1996, MNRAS, 278, 727 [NASA ADS] [CrossRef] [Google Scholar]
- Venn, K. A., Irwin, M., Shetrone, M. D., et al. 2004, AJ, 128, 1177 [NASA ADS] [CrossRef] [Google Scholar]
- Villalobos, Á., & Helmi, A. 2009, MNRAS, 399, 166 [NASA ADS] [CrossRef] [Google Scholar]
- Wilson, M. L., Helmi, A., Morrison, H. L., et al. 2011, MNRAS, 413, 2235 [NASA ADS] [CrossRef] [Google Scholar]
- Wyse, R. F. G., Gilmore, G., Norris, J. E., et al. 2006, ApJ, 639, L13 [NASA ADS] [CrossRef] [Google Scholar]
- Yanny, B., Rockosi, C., Newberg, H. J., et al. 2009, AJ, 137, 4377 [NASA ADS] [CrossRef] [Google Scholar]
- Zhang, H. W., & Zhao, G. 2006, A&A, 449, 127 [NASA ADS] [CrossRef] [EDP Sciences] [Google Scholar]
- Zwitter, T., Siebert, A., Munari, U., et al. 2008, AJ, 136, 421 [NASA ADS] [CrossRef] [Google Scholar]
All Tables
Effects on derived abundances resulting from model changes for the star HD 10519.
Main atmospheric parameters and elemental abundances of the programme and comparison stars.
Elemental abundances of neutron-capture elements for the programme and comparison stars.
All Figures
|
Fig. 1 Velocity distribution for all stars in the sample of Holmberg et al. (2009) (plus signs), stars of Group 2 (circles), and the stars investigated (filled circles). |
| In the text | |
|
Fig. 2 Distribution for the stars in the APL space. Plus signs denote the GCS sample (Holmberg et al. 2009), circles denote Group 2, the filled circles are the stars investigated. Note that the stars investigated as well as all Group 2 stars are distributed in APL space with constant eccentricity. |
| In the text | |
|
Fig. 3 Toomre diagram of all stars of Group 2 (circles) and those investigated in this work (filled circles). Dotted lines indicate constant values of total space velocity in steps of 50 km s-1. |
| In the text | |
|
Fig. 4 Samples of stellar spectra of several programme stars. An offset of 0.5 in relative flux is applied for clarity. |
| In the text | |
|
Fig. 5 Fit to the forbidden [O i] line at 6300.3 Å in the programme star HD 12782. The observed spectrum is shown as a solid line with black dots. The synthetic spectra with [O/Fe] = 0.52 ± 0.1 are shown as dotted lines. |
| In the text | |
|
Fig. 6 Synthetic spectrum fit to the yttrium line at 5402 Å in the observed spectrum of HD 21543 (left panel) and to the barium line at 5853 Å in the observed spectrum of HD 224817. The observed spectra are shown by solid lines with dots. The dotted lines are synthetic spectra with [Y/Fe] = 0.01 ± 0.1 and with [Ba/Fe] = −0.10 ± 0.1, respectively. |
| In the text | |
|
Fig. 7 Synthetic spectrum fit to the lanthanum line at 4662 Å in the observed spectrum of HD 143291 (left panel) and to the neodymium line at 5319 Å in the observed spectrum of HD 24156 (right panel). The observed spectra are shown by solid lines with dots. The dotted lines are synthetic spectra with [La/Fe] = 0.05 ± 0.1 and [Nd/Fe] = 0.12 ± 0.1, respectively. |
| In the text | |
|
Fig. 8 Synthetic spectrum fit to the europium lines at 4129 Å (left) and 6645 Å (right). The observed spectrum for the programme star HD 12782 is shown as a solid line with dots. The dotted lines are synthetic spectra with [Eu/Fe] = 0.40 ± 0.1 and [Eu/Fe] = 0.45 ± 0.1, respectively for these two lines. |
| In the text | |
|
Fig. 9 [El/Fe] ratio as a function of [Fe/H] in the investigated stars of Group 2 (filled circles) and comparison stars analysed in this work and Paper I (open circles). The data for the Milky Way thin-disc dwarfs were taken from Edvardsson et al. (1993, plus signs), Bensby et al. (2005, stars), Reddy et al. (2006, squares), and Zhang & Zhao (2006, triangles). Solid lines are Galactic thin-disc chemical evolution models presented by Pagel & Tautvaišienė (1995). Average uncertainties are shown in the box for Na. |
| In the text | |
|
Fig. 10 [El/Fe] ratio as a function of [Fe/H] in the investigated stars of Group 2 (filled circles) and comparison stars analysed in this work and Paper II (open circles). The data for the Milky Way thin-disc dwarfs were taken from Edvardsson et al. (1993, plus signs), Gratton & Sneden (1994, triangles), Koch & Edvardsson (2002, upside down triangles), Bensby et al. (2005, stars), Reddy et al. (2006, 2003, squares), Brewer & Carney (2006, diamonds), Mashonkina et al. (2007, crosses), and Mishenina et al. (2013, dots). The Galactic thin-disc chemical evolution model is shown as a solid line (Pagel & Tautvaišienė, 1997). Average uncertainties are shown in the box for Zr. |
| In the text | |
|
Fig. 11 [El/Fe] ratio as a function of [Fe/H] in the investigated stars of Group 2 (filled circles) and Group 3 (thick squares, Papers I and II). The data for the Milky Way thick-disc stars were taken from Mishenina et al. (2013, triangles), Mashonkina et al. (2007, crosses), Reddy et al. (2006, squares), and Bensby et al. (2005, stars). The averaged values for alpha-elements consist of Mg, Si, and Ca abundances. |
| In the text | |
|
Fig. 12 HR diagrams of the Group 2 stars. Isochrones are taken from Bressan et al. (2012). The filled circles correspond to the stars investigated with the spectroscopic effective temperatures. Isochrones are with [α/Fe] = 0.2. |
| In the text | |
|
Fig. 13 [Alpha/Fe] ratio as a function of [Fe/H] in the investigated stars of Group 2 (filled circles), in the Arcturus stream (plus signs), and in the AF06 stream (diamonds). The data for Arcturus and AF06 streams were taken from Ramya et al. (2012). The averaged values for alpha-elements consist of Mg, Si, Ca, and Ti abundances. |
| In the text | |
Current usage metrics show cumulative count of Article Views (full-text article views including HTML views, PDF and ePub downloads, according to the available data) and Abstracts Views on Vision4Press platform.
Data correspond to usage on the plateform after 2015. The current usage metrics is available 48-96 hours after online publication and is updated daily on week days.
Initial download of the metrics may take a while.