Fig. 10
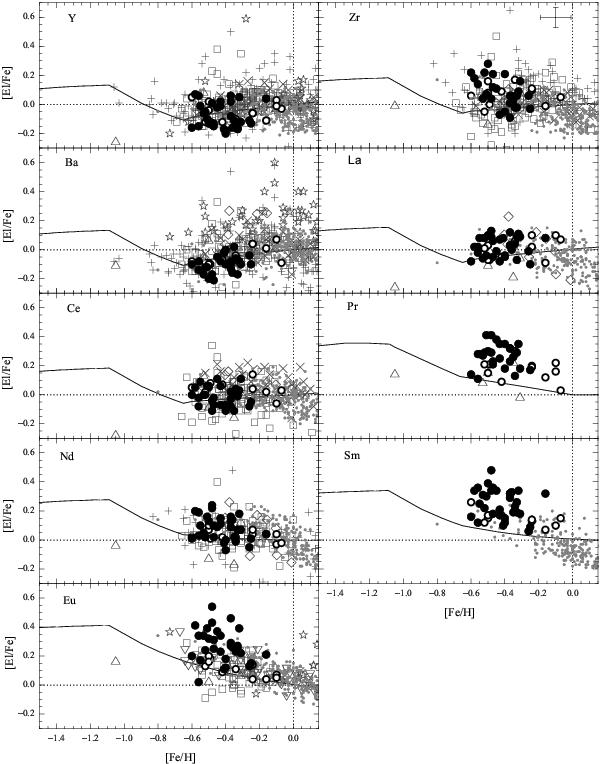
[El/Fe] ratio as a function of [Fe/H] in the investigated stars of Group 2 (filled circles) and comparison stars analysed in this work and Paper II (open circles). The data for the Milky Way thin-disc dwarfs were taken from Edvardsson et al. (1993, plus signs), Gratton & Sneden (1994, triangles), Koch & Edvardsson (2002, upside down triangles), Bensby et al. (2005, stars), Reddy et al. (2006, 2003, squares), Brewer & Carney (2006, diamonds), Mashonkina et al. (2007, crosses), and Mishenina et al. (2013, dots). The Galactic thin-disc chemical evolution model is shown as a solid line (Pagel & Tautvaišienė, 1997). Average uncertainties are shown in the box for Zr.
Current usage metrics show cumulative count of Article Views (full-text article views including HTML views, PDF and ePub downloads, according to the available data) and Abstracts Views on Vision4Press platform.
Data correspond to usage on the plateform after 2015. The current usage metrics is available 48-96 hours after online publication and is updated daily on week days.
Initial download of the metrics may take a while.