| Issue |
A&A
Volume 563, March 2014
|
|
|---|---|---|
| Article Number | A106 | |
| Number of page(s) | 10 | |
| Section | Interstellar and circumstellar matter | |
| DOI | https://doi.org/10.1051/0004-6361/201323219 | |
| Published online | 17 March 2014 | |
Detecting scattered light from low-mass molecular cores at 3.6 μm
Impact of global effects on the observation of coreshine
1
UJF-Grenoble 1/CNRS-INSU, Institut de Planetologie et d’Astrophysique de
Grenoble (IPAG) UMR 5274,
38041
Grenoble,
France
e-mail:
stein@mpia.de
2
Max-Planck-Institut für Astronomie, Königstuhl 17, 69117
Heidelberg,
Germany
Received:
9
December
2013
Accepted:
5
February
2014
Context. Recently discovered scattered light at 3−5 μm from low-mass cores (so-called “coreshine”) reveals the presence of grains around 1 μm, which is larger than the grains found in the low-density interstellar medium. But only about half of the 100+ cores investigated so far show the effect. This prompts further studies on the origin of this detection rate.
Aims. We aim to supply criteria for detecting scattered light at 3.6 μm from molecular cloud cores.
Methods. From the 3D continuum radiative transfer equation, we derive the expected scattered light intensity from a core placed in an arbitrary direction seen from Earth. We use the approximation of single scattering, consider extinction up to 2nd-order Taylor approximation, and neglect spatial gradients in the dust size distribution. We analyze how scattered light can outshine the absorbing effect of extinction in front of background radiation by the core for given grain properties, anisotropic interstellar radiation field and background field. The impact of the directional characteristics of the scattering on the detection of scattered light from cores is calculated for a given grain size distribution, and local effects like additional radiation field components are discussed. The surface brightness profiles of a core with a 1D density profile are calculated for various Galactic locations, and the results are compared to the approximate detection limits.
Results. We find that for optically thin radiation and a constant size distribution, a simple limit for detecting scattered light from a low-mass core can be derived that holds for grains with sizes smaller than 0.5 μm. The extinction by the core prohibits detection in bright parts of the Galactic plane, especially near the Galactic center. For scattered light received from low-mass cores with grain sizes beyond 0.5 μm, the directional characteristics of the scattering favors the detection of scattered light above and below the Galactic center, and to some extent near the Galactic anti-center. We identify the local incident radiation field as the major unknown causing deviations from this simple scheme.
Conclusions. The detection of coreshine at a wavelength of 3.6 μm is a complex interplay of the incident radiation, the extinction of the background radiation, the grain properties, and the core properties like sky position and mass.
Key words: dust, extinction / ISM: clouds / infrared: ISM / scattering
© ESO, 2014
1. Introduction
Dense regions in molecular clouds have been identified as the site where star formation starts. As the initial conditions impact the formation process, much effort has been devoted to analyze the change in conditions from the diffuse interstellar medium (ISM) to these dense cold cores (for an overview, see, e.g., Bergin & Tafalla 2007). Through absorption, scattering and emission, cosmic dust grains embedded in the core gas enshroud the view on the star formation process at optical wavelengths, but also provide information on the physical conditions at longer wavelengths.
A key quantity of the grains is their size distribution. For the diffuse ISM, Mathis et al. (1977) were the first to suggest a power-law distribution with a size limit of 0.25 μm for non-graphite grains (hereinafter called “MRN(0.25)”). They emphasized that only weak constraints could be derived for the larger grains in the distribution. For the denser phases of the ISM, however, the modeling of thermal emission and extinction of grains provided indirect evidence for the existence of a population of grains beyond MRN(0.25) (e.g. Stepnik et al. 2003; Kiss et al. 2006; Ridderstad et al. 2006; Schnee et al. 2008; Chapman et al. 2009; Chapman & Mundy 2009; McClure 2009). Lehtinen & Mattila (1996) modeled the J, H, and K band scattered light images of the Thumbnail nebula and concluded that the limiting grain size exceeds 0.25 μm.
In a recent paper, evidence in the same direction was reported for the core LDN183 by Steinacker et al. (2010) based on the detection of a weak extended surface brightness excess with respect to the large-scale infrared background from the core visible in the 3.6 and 4.5 μm IRAC bands of the Spitzer Space Telescope called “coreshine”. Since the core is too cold for large grain thermal emission, and the emission of stochastically heated particles like polycyclic aromatic hydrocarbons (PAHs) or very small grains should be restricted to the outer parts of the core to receive enough UV/optical energy, the radiation was interpreted as scattered interstellar light. Furthermore, despite the absence of strong stochastically heated emission in the 4.5 μm band, surface brightness excess was seen also in this band. The interpretation as scattered light required a scattering efficiency of the dust that is only provided by grains with radii up to 1 μm.
Although the central core of LDN183 is surrounded by slightly more mass than most low-mass cores, its general conditions were not substantially different from that of many other low-mass cores. Therefore, it was not entirely surprising that an investigation of other cores in the IRAC bands led to the finding that about half of the selected cores showed scattered light (Pagani et al. 2010) (see also Stutz et al. 2009, for a small subsample of cores with 3.6 μm excess).
A radiative transfer analysis of model cores revealed that the scattered light morphology (the morphology referring to the gradients across the core, not the total surface brightness) of low-mass cores should show no strong selection effect with position in the Galaxy aside from a weak enhancement towards the Galactic center (GC). For more massive cores with 10 M⊙, the morphology showed a crescent shaped asymmetry in the morphology of the surface brightness excess. A variation of the total expected flux as a function of sky position was not investigated.
For a special region, namely the Gum/Vela region, Pagani et al. (2012) found a drastically reduced occurrence of scattered light (3 detections plus 3 uncertain cases out of 24 objects). They did not attribute this absence to systematic detection difficulties but to the action of a supernova remnant blast wave which has affected the grain size population in this region. The analysis of scattered light based on IRAC photometry is compromised by PAH emission that in principle can contaminate all four IRAC bands. This is true for any star forming region like ρ Oph or Vela that is irradiated by close medium or high-mass stars. When scattered light and PAH emission regions are spatially separated, one can use the almost PAH-free 4.5 μm band to distinguish or use that the PAHs appear in all four IRAC channels opposite to the scattered light being strongest in the 3.6 μm band and decreasing in flux with wavelengths. When a region shows both scattered light and PAH emission, it is difficult to disentangle them.
The work presented in this paper focuses on deriving the general conditions for the detection of scattered light at wavelength of 3.6 μm from a low-mass molecular cloud core. Assuming various grain size limits, we explore the different factors influencing the detection. In Sect. 2 we derive approximative formula for the coreshine detection limit from the radiative transfer equation. In Sect. 3 we compare the formula with results from a grid of 3D radiative transfer calculations for a model core spanning an all-sky map of coreshine surface brightness profiles. Observational constraints are discussed in Sect. 4 for a set of example cores, and we conclude our findings in Sect. 5.
2. Deriving an approximate coreshine surface brightness formula
2.1. Optical depth and grain size distribution
Determining the radiation observed from a molecular cloud core that is illuminated by an external radiation field requires to run 3D radiative transfer calculations. This is because almost all cores have a complex structure, because the external radiation field is strongly anisotropic, and the size distribution may show spatial variations. So far, only Steinacker et al. (2010) have modeled the core LDN183 in such detail, but the large parameter space is difficult to probe (for a review of the computational challenge see Steinacker et al. 2013). In this section, we will discuss two approximations that reduce the complexity of the detection problem while maintaining the essential physics.
2.1.1. Optical depth approximation
The first approximation is based on the fact that the surface brightness distribution for the cores modeled so far scales with the column density measured, e.g., through the 8 μm absorption profile. This is the case for optical thin scattered light. Only a handful of the densest low-mass cores reveal profile depressions in the central core region. Model calculations for the low-mass cores LDN183 (Steinacker et al. 2010, with depression) and LDN260 (Andersen et al. 2013, without depression) indicate that the depression is caused by optical depth effects. For the majority of cores, the assumption of optically thin scattering and absorption is therefore a reasonable approach. In Sect. 2.2 we will discuss the limits of this assumptions.
The general stationary continuum radiative transfer equation has the form of an integro-differential equation where the scattering integral contains the unknown intensity itself and advanced solution methods like Monte-Carlo or ray-tracing are required (see Steinacker et al. 2013). Since the model calculations performed for Pagani et al. (2010) indicate that almost all cores scatter optically thin at 3.6 μm, we simplify the equation by assuming single scattering. We note that the contribution of the scattering to the extinction depends on the grain size distribution. This means that the limits for using single scattering and approximating the exponential extinction term by terms from the Taylor expansion varies with the grains sizes as discussed in Sect. 2.2.
The 3.6 μm
surface brightness seen from model cores placed at a constant distance around the
observer is ![\begin{eqnarray} I(y,z)&=&{\rm e}^{-\tau_{\rm fg}(y,z)}\Bigg[ I_{\rm bg}(y,z)\ {\rm e}^{-\tau_{\rm ext}(y.z)}+I_{\rm fg}(y,z)\nonumber\\ & & +\int\limits_{-\infty}^{+\infty}{\rm d} x \int\limits_{a_1}^{a_2}{\rm d}a\ n(a,x,y,z)\ \sigma_{\rm sca}(a,x,y,z)\ \left< I_{\rm in}\right>_\Omega \Bigg] \end{eqnarray}](/articles/aa/full_html/2014/03/aa23219-13/aa23219-13-eq8.png) (1)with
the direction-averaged incident radiation field
(1)with
the direction-averaged incident radiation field
 (2)Ibg denotes
the background surface brightness, τext is the optical depth due to
extinction through the core along the line-of-sight (LoS), and a1 and
a2 are the lower and upper limit for the
grain size distribution n. Furthermore, σsca stands
for the scattering cross section, Ifg is the foreground surface
brightness, τfg is the optical depth for foreground
extinction, and p is the normalized phase function of the grains
for scattering from any direction towards the observer.
(2)Ibg denotes
the background surface brightness, τext is the optical depth due to
extinction through the core along the line-of-sight (LoS), and a1 and
a2 are the lower and upper limit for the
grain size distribution n. Furthermore, σsca stands
for the scattering cross section, Ifg is the foreground surface
brightness, τfg is the optical depth for foreground
extinction, and p is the normalized phase function of the grains
for scattering from any direction towards the observer.
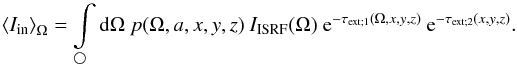
Interstellar radiation on its way to the core position (x,y,z) from a certain solid angle Ω undergoes extinction described by τext;1. The radiation that is scattered by the dust at (x,y,z) and leaves towards the observer again undergoes extinction with the optical depth τext;2. The Cartesian directions are x pointing from the core to the observer, y along the Galactic coordinate l in the Plane of Sky (PoSky), and z perpendicular to y in the PoSky. The set-up is illustrated in Fig. 1.
 |
Fig. 1 Illustration of the choice of coordinates following the scattering of radiation in a core. τext;1 and τext;2 are the optical depth for extinction for incident radiation and radiation being scattered towards the observer, respectively. |
2.1.2. Approximation of the grain size distribution
The second approximation is also motivated by the smooth brightness distribution of
most low-mass cores with coreshine. The images derived for LDN183 in Steinacker et al. (2010) used spatial gradients in
the grain size distribution and the resulting surface brightness gradients were steeper
than in the observed images. We therefore assume here like in Andersen et al. (2013) for the core LDN260 and in Steinacker et al. (2014) for LDN1506C a spatially
constant size distribution  (3)with the size
distribution s and the spatial distribution1t. The optical depth for extinction then takes the
form
(3)with the size
distribution s and the spatial distribution1t. The optical depth for extinction then takes the
form  (4)with
the column density
(4)with
the column density  (5)and the size
distribution-averaged extinction cross section
(5)and the size
distribution-averaged extinction cross section  (6)
(6)
2.2. Coreshine surface brightness using first-order Taylor terms
In the following, we will neglect the optically thin foreground extinction exp(−τfg) that attenuates the flux of the radiation finally leaving the core towards the observer. This additional extinction may be caused by a core surrounding cloud or by diffuse dust not related to the core hosting cloud. The additional extinction decreases the detection rate of coreshine for distant or deeply embedded low-mass cores since it moves the ratio of coreshine intensity and background intensity towards the detection limit of the instrument.
We expand the extinction factor exp(−τ) ≈ 1−τ as Taylor series
in first-order around τ = 0. Considering single scattering, a constant
grain size distribution, and only expressions up to the order τ the surface brightness
for radiation I along the line-of-sight is  (7)The
term that prevents combining the integrals over the grain sizes and the solid angles is
the phase function p(Ω,a) depending on both
quantities.
(7)The
term that prevents combining the integrals over the grain sizes and the solid angles is
the phase function p(Ω,a) depending on both
quantities.
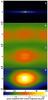 |
Fig. 2 a) DIRBE all-sky map used as incident radiation field with surface brightnesses ranging from 0.08 to 12.6 MJy/sr. b)−d) Three all-sky maps in Galactic coordinates centered on the GC. The maps show the phase function-integrated surface brightness of ISRF radiation being completely scattered by a cell with dust at each sky location towards the observer. The maximal grain size of the dust size distribution is 0.25 a); 0.5 b); and 1 μm c); respectively. Local maxima arise near the Galactic plane (especially near the Galactic center and the anti-center) due to peaks in the phase function for forward and backward scattering. |
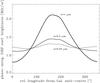 |
Fig. 3 Horizontal cut through the phase-integrated surface brightness shown in Fig. 2 in the Galactic midplane for the three maximal grain sizes 0.25, 0.5, 1 μm. |
The overall effect of the phase function is to narrow the scattering angle distribution once 2πa > λ. The strong beaming of the phase function is shown in polar coordinates for spherical homogenous silicate grains of various sizes at λ = 3.6 μm in Fig. 7 in Steinacker et al. (2010). It is evident that the phase function is not constant even for small grains.
To explore the impact of the phase function on the coreshine, we assume a size distribution, an ISRF, and dust opacities. We consider a grain size distribution MRN(a2). The impacting radiation field IISRF is approximated by the zodiacal light-subtracted 3.5 μm Diffuse Infrared Background Experiment (DIRBE) map provided by LAMBDA2. A local component of the ISRF in addition to the ISRF is discussed below. The grain opacities are taken from Draine & Lee (1984). The phase function is usually given as a probability for scattering from one direction into another as a function of the scattering angle between the two directions (see, e.g., as used in this work, Draine 2003). But rather than integrating over the scattered radiation in all directions, we are here interested in integrating the radiation that is scattered into one direction (the LoS) and coming from all directions. The simplest choice is a spherical grid where the solid angles (the weights of the integration) are calculated from the spherical ΔΩ attached to the direction in discretized spherical coordinates. A disadvantage is that this grid increases resolution at the poles and that might not always be the direction where the integrand has its strongest gradients. Therefore, also direction distributions with equal solid angles are in use. Steinacker et al. (1996) have proposed to calculate nearly isotropically distributed direction grids and solid angles with a Metropolis optimizer for any number of grid points. Alternatively, a HEALpix distribution can be used which uses constant solid angles for specific numbers of grid points3 (used, e.g. for the DIRBE data). Monte-Carlo radiative transfer solvers, in turn, do not discretize the direction space and choose a random direction from a probability function determined by the integrand. Since our main radiative transfer code uses a spherical grid, we have kept this choice for practical reasons.
Figure 2 shows the allsky map used as incident
radiation and three maps of  (8)for a dust cell
placed at any direction Ωcell in the sky for the grain sizes a2 = 0.25, 0.5,
and 1 μm
(bottom). The strongly anisotropic ISRF of the Galaxy is smoothed out with remaining
gradients increasing with maximal grain size. The gradients can also be inferred from the
profiles along horizontal cuts through the images in the midplane as shown in Fig. 3 for the three maximal grain sizes.
(8)for a dust cell
placed at any direction Ωcell in the sky for the grain sizes a2 = 0.25, 0.5,
and 1 μm
(bottom). The strongly anisotropic ISRF of the Galaxy is smoothed out with remaining
gradients increasing with maximal grain size. The gradients can also be inferred from the
profiles along horizontal cuts through the images in the midplane as shown in Fig. 3 for the three maximal grain sizes.
For grains up to 0.5 μm the variations are of the order of 30% and we
therefore first discuss the detection of coreshine for grains up this size limit using the
approximation ⟨ pIISRF ⟩ Ω ≈ ⟨ IISRF ⟩,
and will later explore the usage of phase functions with stronger beaming for grains with
sizes beyond 0.5 μm. Eq. (7) then for each location (y,z) in the PoSky has the form  (9)(compare to
Lehtinen & Mattila 1996, Eq. (8), their
formula adopts the background, but they neglect it for the Thumbprint nebula).
(9)(compare to
Lehtinen & Mattila 1996, Eq. (8), their
formula adopts the background, but they neglect it for the Thumbprint nebula).
Without incident radiation, the core is seen in extinction against the background radiation with the intensity Ibg being absorbed and scattered out of the LoS. When increasing IISRF, the effect of extinction of Ibg is in part compensated by radiation scattered into the LoS. The profile of the surface brightness flattens until enough scattered light along the LoS is created to compensate for the extinction.
In the following, we call this case “scattering-extinction balance”. Its condition
 (10)on
the right-hand side only depends on the properties of the grain size distribution
described by the albedo w. In Fig. 4,
the albedo is plotted as a function of the upper limit for the grain radius for the MRN
size distribution and the silicate and graphite opacities. The total dust mass is the same
for all curves. The dotted line indicates the chosen grain size limit for assuming
P ≈ ⟨ IISRF ⟩.
(10)on
the right-hand side only depends on the properties of the grain size distribution
described by the albedo w. In Fig. 4,
the albedo is plotted as a function of the upper limit for the grain radius for the MRN
size distribution and the silicate and graphite opacities. The total dust mass is the same
for all curves. The dotted line indicates the chosen grain size limit for assuming
P ≈ ⟨ IISRF ⟩.
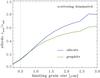 |
Fig. 4 Albedo based on the size-averaged scattering and extinction cross-section assuming an MRN distribution as a function of the maximum grain size for silicate and graphite (Draine & Lee 1984). The dotted line indicates the limiting grain size where the error due to neglecting the phase function in the scattering integral is less than 30%. |
Since the albedo is always smaller than 1, a scattering-extinction balance can only occur
when 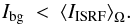 (11)Moreover, the
smaller the grain size limit, the more incident radiation is needed to reach at least the
scattering-extinction balance condition or observe coreshine. In the case of a typical
diffuse ISM MRN(0.25), the incident field can create coreshine above the balance when it
is more than about 20 times stronger than the background field.
(11)Moreover, the
smaller the grain size limit, the more incident radiation is needed to reach at least the
scattering-extinction balance condition or observe coreshine. In the case of a typical
diffuse ISM MRN(0.25), the incident field can create coreshine above the balance when it
is more than about 20 times stronger than the background field.
This implies the interesting conclusion that coreshine can be observed even for MRN(0.25). But the enhancement of the ISRF of about 20 over the background is rarely met if no stellar source is located in the immediate vicinity of the core, or the core is part of a massive star formation region.
A complication is a background variation across the core. This can not be compensated by subtracting a function describing the background. The reason is that the background also enters the scattering-extinction balance condition causing regions of suppressed flux in the coreshine surface brightness morphology of the core. For the following simple considerations we will neglect background gradients across the core.
In order to investigate the regions in the sky for which coreshine would be observable according to the scattering-extinction balance condition, we have to determine Ibg, ⟨IISRF⟩Ω, and define the grain size distribution.
-
(a)
⟨IISRF⟩Ω: we assume that the radiation field impacting the cores can be approximated by the DIRBE 3.5 μm once the contamination from stars is removed. This is only to be modified when local effects like absorption by a nearby core or filament segment or illumination by neighboring stars or photodissociation regions alter the local radiation field.
-
(b)
s(a): we use an MRN distribution with a sharp cut-off at a maximal grains radius a2. The phase function starts to impact the scattering integral with deviations beyond 30% (assuming Draine & Lee 1984, opacities) for grains larger than 0.5 μm and needs to be considered in the scattering-extinction balance condition for distributions with grains beyond this size.
-
(c)
Ibg: there is no absolutely calibrated map of the 3.6 μm sky with the resolution of a few beams across a low-mass core of typical diameter 150″ with distances <500 pc. The WISE all-sky maps only provide relative photometric measurements. Akari only provides relative photometric measurements all-sky maps at 9 μm or larger. The all-sky 3.5 μm DIRBE map remains the highest-resolving map to be used. However, this map might not be a realistic representation of the background field behind the core for two reasons. First, the DIRBE map consists of large Healpix segments4 with an average size of 0.35°× 0.23° which is smaller than the observing beam where all background variations behind the cores with typical scales of about 150′′ are averaged to a single value. Second, the DIRBE map contains the stellar component which does not enter the coreshine modeling. This overestimates the background, and the stellar component must be subtracted using the WISE data.
Figure 5 (top panel) shows the scattering-extinction balance distribution for 0.5 μm grains as white contours on top of the DIRBE all-sky map (−40° to +40° in latitude). The map shows two general features. There is an inner part without contour lines. In this “DIRBE dark zone” the background exceeds the mean interstellar radiation field and no coreshine is expected according to Eq. (11). The zone encloses most of the Galactic plane and especially the GC. Outside the zone the contour map shows substantial variation on small scales so that local effects dominate whether coreshine is observable. In the outer parts of the map the overall decreasing background makes coreshine detection more likely again. The DIRBE map overestimates the background due to the stellar content. Hence, we have approximately corrected by dividing the DIRBE flux by a number that was derived as follows. We investigated the background given by DIRBE for a few cores subtracting the stellar content based on the WISE maps (Andersen et al. 2013), and found that the fluxes are reduced by a factor of the order of 2. This is the value we used here. We note that a correct subtraction of the stellar component would reduce the gradients in the background and therefore in the shown contours for the scattering-extinction balance distribution but not modify the global separation between dark zone, variation region, and range with possible detection of coreshine.
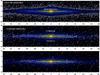 |
Fig. 5 Color-coded is the DIRBE all-sky map between latitudes of −40° and +40° at 3.5 μm which serves as background after subtracting the stellar contamination. Overlaid are contours of the scattering-extinction balance for MRN(0.5) (top), for MRN(1) taking into account phase function effects and treating extinction in 1st-order Taylor approximation (middle), and for MRN(1) and 2nd-order Taylor approximation (bottom), respectively. |
Both the modeling with spatial grain size variations by Steinacker et al. (2010) and with spatially constant grain size distributions by
Andersen et al. (2013) found that the modeling of
the core surface brightnesses require the presence of larger grains. Therefore, we relax
our assumptions and allow for grains larger than 0.5 μm, which requires allowing
for a directional dependence of the phase function. The scattering-extinction balance
condition Eq. (10) then becomes
 (12)In this case, the
location of the core enters both by the local background and the global relation of core
position and anisotropic illumination by the ISRF via the phase function. Moreover, the
increased grain size moves the albedo closer to unity as visible in Fig. 4.
(12)In this case, the
location of the core enters both by the local background and the global relation of core
position and anisotropic illumination by the ISRF via the phase function. Moreover, the
increased grain size moves the albedo closer to unity as visible in Fig. 4.
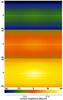 |
Fig. 6 Impact of the phase function as a global effect on the observation of coreshine: shown are three all-sky maps of the scattered light surface brightness from a 1 M⊙ core that is placed in all directions seen from Earth. Three limiting grain sizes are considered (top to bottom): 0.25, 0.5 and 1 μm. |
The effect of allowing larger grains size limits of the grain distribution is two-fold:
-
(a)
The phase function directional dependence. The scatteringintegral in Eq. (7) folds the phase function with itstwo maxima at forward and backward scattering with theband-like ISRF direction morphology of the DIRBE map andboosts the contribution weighted with the scattering efficiency.The resulting scattering integral contribution from a standard1 M⊙ core is shown in Fig. 6 as three all-sky maps in Galactic coordinates centered on the GC for the limiting grains sizes 0.25, 0.5 and 1 μm (top to bottom). The amplification due to the phase function and the scattering cross section make the scattering integral largest at the GC and its vicinity.
-
(b)
The enhanced scattering due to big grains. The larger grains increase the albedo shown in Fig. 4 thus allowing for larger background values to still meet the scattering-extinction balance condition for a given incident radiation field. This shrinks the DIRBE darkzone and coreshine can be observed in a larger portion of the sky compared to the coreshine detection for smaller grains. The corresponding balance contours are shown in Fig. 5 (middle) on top of the DIRBE map (white contours for the DIRBE map used as background, yellow for using a DIRBE map with half the intensity that corrects for the stellar contribution).
To explore the limits of the validity of the underlying approximations of optically thin
scattering τsca ≪ 1 and the 1st- and 2nd-order Taylor
expansion of exp−τext, we have calculated the
optical depth for absorption and scattering for about 3 million rays through a standard
core with a mass of 1 M⊙ with about 600 direction per spatial
point. In Fig. 7 we show the number distribution of
rays per optical depth for absorption (red), scattering (pink), and extinction (black),
respectively. The thin lines represent a core with an MRN(0.25) size distribution. Since
all grains are in the Rayleigh limit at this wavelength, scattering predominantly occurs
with smaller optical depths than absorption and the absorption and extinction distribution
are close to each other. We also indicate the limit in τext where only
5% of all rays have a larger optical depths as vertical dash-dotted line. For an MRN(1)
distribution, scattering dominates over absorption, and the distribution is moved towards
larger optical depth values. In the right upper corner we indicate three limiting
τ-values by
vertical bars: at about τ = 0.4, the relative 1st-order Taylor expansion
error 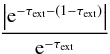 reaches
10%, at about τ = 0.7, the relative 2nd-order error reaches 10%,
and slightly below τ = 0.4 the probability for second scattering
(1−e−τext)2
reaches 10%. Compared with the ray number distributions for MRN(1), about 5% of all rays
encounter extinction where the probability for second scattering is above 10% and where
the first-order approximation of the extinction fails by 10%. Due to the centrally-peaked
profile of the core, these are rays through the central part of the core. For cores larger
than the assumed 1 M⊙, this will be the region where
deviations from the derived extinction-scattering balance will appear first.
reaches
10%, at about τ = 0.7, the relative 2nd-order error reaches 10%,
and slightly below τ = 0.4 the probability for second scattering
(1−e−τext)2
reaches 10%. Compared with the ray number distributions for MRN(1), about 5% of all rays
encounter extinction where the probability for second scattering is above 10% and where
the first-order approximation of the extinction fails by 10%. Due to the centrally-peaked
profile of the core, these are rays through the central part of the core. For cores larger
than the assumed 1 M⊙, this will be the region where
deviations from the derived extinction-scattering balance will appear first.
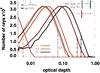 |
Fig. 7 Number distribution of rays through a standard core as a function of the optical depth for absorption (red), scattering (pink), and extinction (black), respectively. The thin and thick lines correspond to MRN(0.25) and MRN(1) distributions, respectively. The dash-dotted lines give the limiting τ for which 5% of all rays have larger τ. The three vertical bars in the upper left corner indicate the τ values for which the relative error in the Taylor expansion of the extinction in first and second order reaches 10%, and the τ where the probability for second scattering reaches 10%. |
2.3. Coreshine surface brightness using second-order Taylor terms
For optical depths beyond τ = 0.4 (see Fig. 7) caused by larger column densities, second-order Taylor terms for the approximation of τ appear in the balance condition. Neglecting third-order terms, the surface brightness for radiation along the line-of-sight becomes
with the directional transmission function ![\begin{equation} D= \int\limits_{-\infty}^{+\infty}{\rm d}x\ \left[ N_1(\Omega,x,y,z)+N_2(x,y,z) \right] t(x,y,z)\label{2ndTayl} \end{equation}](/articles/aa/full_html/2014/03/aa23219-13/aa23219-13-eq68.png) (14)depending only on
the spatial density structure, the column density N1 from a point
(x,y,z) in
the direction Ω and
N2 from the point to the observer. Two new
terms arise compared to Eq. (7). The first
term
(14)depending only on
the spatial density structure, the column density N1 from a point
(x,y,z) in
the direction Ω and
N2 from the point to the observer. Two new
terms arise compared to Eq. (7). The first
term  is
a positive τ2-correction to the extincted background
radiation, and reduces the background impact on the observed profile. The second term
corrects for extinction effects of the incident radiation field.
is
a positive τ2-correction to the extincted background
radiation, and reduces the background impact on the observed profile. The second term
corrects for extinction effects of the incident radiation field.
The scattering-extinction balance condition in second-order approximation for grains with
a < 0.5 μm
now reads  (15)For
small τext = ⟨σext⟩sN,
Eq. (15) is similar to the 1st-order
condition Eq. (10) on the left hand side
of the equation. The impact of the directional coupling via the extinction of the incident
radiation described by the directional transmission function, however, strongly depends on
the core structure and its position in the sky with respect to the GC. A density
enhancement towards the GC, e.g., can reduce the incident radiation so that the correction
term containing D impacts the balance condition by shielding.
(15)For
small τext = ⟨σext⟩sN,
Eq. (15) is similar to the 1st-order
condition Eq. (10) on the left hand side
of the equation. The impact of the directional coupling via the extinction of the incident
radiation described by the directional transmission function, however, strongly depends on
the core structure and its position in the sky with respect to the GC. A density
enhancement towards the GC, e.g., can reduce the incident radiation so that the correction
term containing D impacts the balance condition by shielding.
For simple spherically symmetric cores with a radially decreasing density, the
directional transmission function has no strong impact on the detection of coreshine from
cores with τsca < 0.7: Fig.
8 shows the ratio D/N for grid
cells in a standard core with a radial number density profile of the form 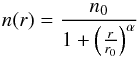 (16)inside
Rout = 10 000 au with the density
normalization n0 corresponding to a core mass of 1
M⊙, the radius of the flat inner region
r0 = 1000 au where the profiles changes
from flat to power-law, and the power-law index α = 1.6. Since typical mean extinction cross
sections for 1 μm-sized silicate grains are of the order of
10-16
m2, estimating
the contribution of each factor, and using the upper limit derived from Fig. 8, we find that the second extinction correction term on
the right hand side of Eq. (15) can be
neglected compared to the first-order term for this type of core at λ = 3.6μm.
(16)inside
Rout = 10 000 au with the density
normalization n0 corresponding to a core mass of 1
M⊙, the radius of the flat inner region
r0 = 1000 au where the profiles changes
from flat to power-law, and the power-law index α = 1.6. Since typical mean extinction cross
sections for 1 μm-sized silicate grains are of the order of
10-16
m2, estimating
the contribution of each factor, and using the upper limit derived from Fig. 8, we find that the second extinction correction term on
the right hand side of Eq. (15) can be
neglected compared to the first-order term for this type of core at λ = 3.6μm.
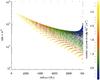 |
Fig. 8 Directional transmission function normalized to the column density as a function of the radius for grid cells in a spherically symmetric standard molecular cloud core. The colors indicate the column density. |
For grains with a > 0.5μm, the correction term for the extinction can substantially contribute since the grain cross section for extinction is dominated by the scattering process. Correspondingly, the 2nd-order balance region with zero coreshine detection in Fig. 5 (bottom) encloses a smaller region than the 1st-order balance region for zero coreshine in the middle panel of Fig. 5.
Finally, we note that the used balance limits do not include the sensitivity limit of a particular instrument like that of IRAC band1 in the cryo or post-cryo phase. To be detectable by that instrument the coreshine surface brightness must be larger than the background surface brightness and the limit of the instrument. For a post-cryo measurement of the surface brightness of coreshine in LDN260, e.g., the brightness maximum is about a factor of 18 above the sensitivity limit, but this additional detection barrier can increase the dark zone of coreshine detection.
3. Radiative transfer calculations for scattered light from a model core
To test the approximate scattering-extinction balance border, we have performed a grid of radiative transfer calculations for a model core placed in various regions of the sky. We model the scattered light at 3.6 μm from a core with the density described by Eq. (16), a radius of 10 000 au and a mass of 1 M⊙ using a 3D single-scattering radiative transfer code. The core density follows a radial power-law with index −1.5 and a flattening radius of 2500 au. Derived from the general code applied in Steinacker et al. (2010), the code utilizes size distribution-integrated opacities (for details, see Sect. 2.4 in Steinacker et al. 2013). The scattering of the ISRF by an MRN grain size distribution is calculated with varying upper size limits. The grain absorption and scattering efficiencies are computed following the Mie theory for spherical grains. The cores are illuminated by the ISRF only, without any local enhancement. The code has also been used to generate fits to the near-IR and 3.6 μm surface brightness profiles of the LDN260 core in Andersen et al. (2013). For each ray followed in the code, the optical depth is calculated, and we found more than 95% of the rays stayed within the limits of the optical thin absorption and scattering for the assumed core and grain properties.
To illustrate the analytical detection criteria, we show in Fig. 9 the surface brightness cut through the center of a core located at l = 30° and at various latitudes b from a LoS very close to Galactic plane (5°) to a high-latitude core at b = 80°. The background flux has been subtracted. As expected absorption of the strong background dominates if the core is located at 5° and the profile is seen in absorption. Cores located at higher latitudes are seen in excess compared to the background. The maximum excess is obtained for cores located between 20° and 40°. Beyond 40°, the scattering efficiency towards the observer is depressed by the phase function, which favors forward scattering.
 |
Fig. 9 Surface brightness profiles at λ = 3.6 μm of a spherically symmetric standard core along a cut through the PoSky-projected core center position for a core at various Galactic coordinates. |
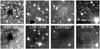 |
Fig. 10 Spitzer 3.6 μm (top) and 8 μm (bottom) images of, from left to right, LDN328, LDN1746, LDN1507, and BHR14. North is up and east is to the left. Each image is 5′ square. LDN1746 shows coreshine despite being located close to the Galactic plane and is predicted not to. However, the YSOs around LDN1746 are additional illumination sources. BHR14 shows clear surface brightness excess at 3.6 μm but also PAH emission at 8 μm. |
4. Investigating local effects for a set of example cores
The list of cores with potential coreshine candidates presented in Pagani et al. (2010) was based on a visual examination of the IRAC bands, searching for an excess of surface brightness at 3.6 μm where extinction is found at 8 μm. This was a sufficient approach to start the exploration of the global appearance of the coreshine effect. The strong local variation of the background, the possible appearance of PAH emission in regions with a stronger local field like Rho Ophiuchi, or a weak background at 8 μm causing a weak extinction contrast, however, makes a global assessment of the appearance of coreshine in all observed cores difficult. The correct way therefore is to model the cores individually including all local effects and to assemble a coreshine detection list this way.
Therefore, instead of presenting an updated list of candidate cores which appear to show coreshine based on a subjective “by-eye” criterion, we discuss the impact of local effects for a sample of cores in and outside of the Galactic plane. This is to prepare forth-coming detailed core-by-core radiative transfer modeling based on the global detection criteria proposed in this paper and discussing all local effects.
Figure 10 shows Spitzer images for the four example cores which we will discuss in the following. The upper images refer to 3.6 μm, the lower 8 μm images are added as additional source of information.
LDN328 is an example of a core near the Milky Way midplane, close to the GC situated at (l,b) = (13.3°, −0.83°) where the background is expected to be very high. Indeed, the COBE/DIRBE all-sky map provides a line of sight surface brightness of 2.4 MJy/sr after stars have been subtracted from each DIRBE pixel using the WISE point source catalog as discussed in Andersen et al. (2013). The coreshine from the model core used in Sect. 3 in the same region of the sky shows a strong extinction profile and indeed, the left image of Fig. 10 shows the core in absorption.
LDN1746 is located above the GC (l,b) = (357.13°, +07.17°) and has a b too low to be outside the main bulge of extinction. The DIRBE/COBE star subtracted background is 0.4 MJy/sr which is stronger than the ISRF. However, LDN1746 (also called B59) is known to be the only core in the pipe nebula with young stellar objects (YSOs) close by. Future modeling of this complex source will reveal if they are close enough to provide a local ISRF as a source for the coreshine that is seen in Fig. 10.
LDN1507 in Taurus is conversely in a low background region below the anti-center. Located at (l,b) = (171.51°, −10.59°) the star subtracted background is only 0.04 MJy/sr. Backscattering of most of the Milky Way radiation plus the contribution from the outer Milky Way in this direction is therefore sufficient for coreshine to be brighter than the background, as observed.
BHR14 is situated in the Gum/Vela region (253.82, −10.9). Clear excess of surface brightness is seen at 3.6 μm. However, excess is also evident at 8 μm suggesting strong PAH emission which is also contaminating the 3.6 μm bandpass. This in general makes it difficult to identify coreshine compared to the PAH emission.
5. Concluding summary
We find that the detection of scattered light at 3.6 μm from low-mass molecular cloud cores is both influenced by local effects like the radiation field in the vicinity of the core and global effects like the interplay of core position with respect to the GC and the directional characteristics of the scattering. For optically thin radiation and a constant grain size distribution throughout the core, we derive a simple limit for detecting coreshine that holds for grains with sizes smaller than 0.5 μm. The extinction of background radiation by the core prohibits detection in large parts of the Galactic plane and especially near the LoS towards the GC. For grain distributions extending to 1 μm, the forwardly-peaked directional characteristics of the scattering favors the detection of coreshine near the GC. After combining the two effects, we identify regions above and below the GC and anti-center to be those with enhanced detection. Two further quantities enter the scattering-extinction balance formula: the local background and the local ISRF. In this work we use the only all-sky map having an absolute flux calibration which is the DIRBE map. Due to the coarse Healpix grid it provides only a mean value where strong deviations can occur locally. Moreover, it contains the stellar contribution which is not included in the core background modeling. Another uncertainty is the local incident radiation field that is observed in star formation regions and that is likely produced by the warm dust near the forming stars. Its directional variation, flux, and spectrum is unknown however, and very difficult to measure. We expect that only individual core modeling may derive constraints on the local field: for the core LDN260 modeled in (Andersen et al. 2013) an enhancement of the incident radiation field was necessary to reproduce the observed coreshine. The derived scheme can be used to identify cores which deviate from the expected flux and might be of interest in terms of nearby radiation sources, PAH contamination, or grain properties. Combining the global constraints on coreshine detection, cores above or below the GC are best detectable. The moderate amplification by backward scattering of GC radiation along with the lower background supports detection of coreshine near the anti-center.
The opacities by Draine & Lee (1984) used in this paper have served as reference data for decades as much as later work showed in how much modification in the chemical composition, shape, size distribution will alter the values. It remains true however that we have little observational information on the exact properties of larger grains which leaves ample room for changing the dust properties and distribution and arriving at the same effects. Therefore, instead of investigating the impact of various dust model assumptions on the derived global effects, we expect progress from modeling multiwavelength data for a large number of single cores as presented in Steinacker et al. (2010)
and Andersen et al. (2013) where dust modeling is better constrained. Future work also will include results from coagulation calculations (Steinacker et al. 2014).
We note that this does not necessarily exclude locally acting grain growth mechanisms proposed for cores (Ossenkopf 1993; Weidenschilling & Ruzmaikina 1994; Ormel et al. 2011), as long as the turbulence that creates the relative motions of the grains also provides turbulent mixing to smooth out spatial gradients in n.
Acknowledgments
J.S., M.A. and W.F.T. acknowledge support from the ANR (SEED ANR-11-CHEX-0007-01). We thank L. Pagani, M. Juvela, R. Paladini, and C. Lefèvre for helpful discussions, and the referee for the constructive comments which helped to improve the manuscript.
References
- Andersen, M., Steinacker, J., Thi, W.-F., et al. 2013, A&A, 559, A60 [NASA ADS] [CrossRef] [EDP Sciences] [Google Scholar]
- Bergin, E. A., & Tafalla, M. 2007, ARA&A, 45, 339 [NASA ADS] [CrossRef] [Google Scholar]
- Chapman, N. L., & Mundy, L. G. 2009, ApJ, 699, 1866 [NASA ADS] [CrossRef] [Google Scholar]
- Chapman, N. L., Mundy, L. G., Lai, S.-P., & Evans, II, N. J. 2009, ApJ, 690, 496 [NASA ADS] [CrossRef] [Google Scholar]
- Draine, B. T. 2003, ApJ, 598, 1017 [NASA ADS] [CrossRef] [Google Scholar]
- Draine, B. T., & Lee, H. M. 1984, ApJ, 285, 89 [Google Scholar]
- Kiss, C., Ábrahám, P., Laureijs, R. J., Moór, A., & Birkmann, S. M. 2006, MNRAS, 373, 1213 [NASA ADS] [CrossRef] [Google Scholar]
- Lehtinen, K., & Mattila, K. 1996, A&A, 309, 570 [NASA ADS] [Google Scholar]
- Mathis, J. S., Rumpl, W., & Nordsieck, K. H. 1977, ApJ, 217, 425 [NASA ADS] [CrossRef] [Google Scholar]
- McClure, M. 2009, ApJ, 693, L81 [NASA ADS] [CrossRef] [Google Scholar]
- Ormel, C. W., Min, M., Tielens, A. G. G. M., Dominik, C., & Paszun, D. 2011, A&A, 532, A43 [NASA ADS] [CrossRef] [EDP Sciences] [Google Scholar]
- Ossenkopf, V. 1993, A&A, 280, 617 [NASA ADS] [Google Scholar]
- Pagani, L., Steinacker, J., Bacmann, A., Stutz, A., & Henning, T. 2010, Science, 329, 1622 [NASA ADS] [CrossRef] [PubMed] [Google Scholar]
- Pagani, L., Lefèvre, C., Bacmann, A., & Steinacker, J. 2012, A&A, 541, A154 [NASA ADS] [CrossRef] [EDP Sciences] [Google Scholar]
- Ridderstad, M., Juvela, M., Lehtinen, K., Lemke, D., & Liljeström, T. 2006, A&A, 451, 961 [NASA ADS] [CrossRef] [EDP Sciences] [Google Scholar]
- Schnee, S., Li, J., Goodman, A. A., & Sargent, A. I. 2008, ApJ, 684, 1228 [NASA ADS] [CrossRef] [Google Scholar]
- Steinacker, J., Thamm, E., & Maier, U. 1996, J. Quant. Spectr. Rad. Transf., 56, 97 [Google Scholar]
- Steinacker, J., Pagani, L., Bacmann, A., & Guieu, S. 2010, A&A, 511, A9 [NASA ADS] [CrossRef] [EDP Sciences] [Google Scholar]
- Steinacker, J., Baes, M., & Gordon, K. D. 2013, ARA&A, 51, 63 [NASA ADS] [CrossRef] [Google Scholar]
- Steinacker, J., Ormel, C., Andersen, M., & Bacmann, A. 2014, A&A, submitted [Google Scholar]
- Stepnik, B., Abergel, A., Bernard, J.-P., et al. 2003, A&A, 398, 551 [NASA ADS] [CrossRef] [EDP Sciences] [Google Scholar]
- Stutz, A. M., Rieke, G. H., Bieging, J. H., et al. 2009, ApJ, 707, 137 [NASA ADS] [CrossRef] [Google Scholar]
- Weidenschilling, S. J., & Ruzmaikina, T. V. 1994, ApJ, 430, 713 [NASA ADS] [CrossRef] [Google Scholar]
All Figures
|
Fig. 1 Illustration of the choice of coordinates following the scattering of radiation in a core. τext;1 and τext;2 are the optical depth for extinction for incident radiation and radiation being scattered towards the observer, respectively. |
| In the text | |
|
Fig. 2 a) DIRBE all-sky map used as incident radiation field with surface brightnesses ranging from 0.08 to 12.6 MJy/sr. b)−d) Three all-sky maps in Galactic coordinates centered on the GC. The maps show the phase function-integrated surface brightness of ISRF radiation being completely scattered by a cell with dust at each sky location towards the observer. The maximal grain size of the dust size distribution is 0.25 a); 0.5 b); and 1 μm c); respectively. Local maxima arise near the Galactic plane (especially near the Galactic center and the anti-center) due to peaks in the phase function for forward and backward scattering. |
| In the text | |
|
Fig. 3 Horizontal cut through the phase-integrated surface brightness shown in Fig. 2 in the Galactic midplane for the three maximal grain sizes 0.25, 0.5, 1 μm. |
| In the text | |
|
Fig. 4 Albedo based on the size-averaged scattering and extinction cross-section assuming an MRN distribution as a function of the maximum grain size for silicate and graphite (Draine & Lee 1984). The dotted line indicates the limiting grain size where the error due to neglecting the phase function in the scattering integral is less than 30%. |
| In the text | |
|
Fig. 5 Color-coded is the DIRBE all-sky map between latitudes of −40° and +40° at 3.5 μm which serves as background after subtracting the stellar contamination. Overlaid are contours of the scattering-extinction balance for MRN(0.5) (top), for MRN(1) taking into account phase function effects and treating extinction in 1st-order Taylor approximation (middle), and for MRN(1) and 2nd-order Taylor approximation (bottom), respectively. |
| In the text | |
|
Fig. 6 Impact of the phase function as a global effect on the observation of coreshine: shown are three all-sky maps of the scattered light surface brightness from a 1 M⊙ core that is placed in all directions seen from Earth. Three limiting grain sizes are considered (top to bottom): 0.25, 0.5 and 1 μm. |
| In the text | |
|
Fig. 7 Number distribution of rays through a standard core as a function of the optical depth for absorption (red), scattering (pink), and extinction (black), respectively. The thin and thick lines correspond to MRN(0.25) and MRN(1) distributions, respectively. The dash-dotted lines give the limiting τ for which 5% of all rays have larger τ. The three vertical bars in the upper left corner indicate the τ values for which the relative error in the Taylor expansion of the extinction in first and second order reaches 10%, and the τ where the probability for second scattering reaches 10%. |
| In the text | |
|
Fig. 8 Directional transmission function normalized to the column density as a function of the radius for grid cells in a spherically symmetric standard molecular cloud core. The colors indicate the column density. |
| In the text | |
|
Fig. 9 Surface brightness profiles at λ = 3.6 μm of a spherically symmetric standard core along a cut through the PoSky-projected core center position for a core at various Galactic coordinates. |
| In the text | |
|
Fig. 10 Spitzer 3.6 μm (top) and 8 μm (bottom) images of, from left to right, LDN328, LDN1746, LDN1507, and BHR14. North is up and east is to the left. Each image is 5′ square. LDN1746 shows coreshine despite being located close to the Galactic plane and is predicted not to. However, the YSOs around LDN1746 are additional illumination sources. BHR14 shows clear surface brightness excess at 3.6 μm but also PAH emission at 8 μm. |
| In the text | |
Current usage metrics show cumulative count of Article Views (full-text article views including HTML views, PDF and ePub downloads, according to the available data) and Abstracts Views on Vision4Press platform.
Data correspond to usage on the plateform after 2015. The current usage metrics is available 48-96 hours after online publication and is updated daily on week days.
Initial download of the metrics may take a while.