Fig. 7
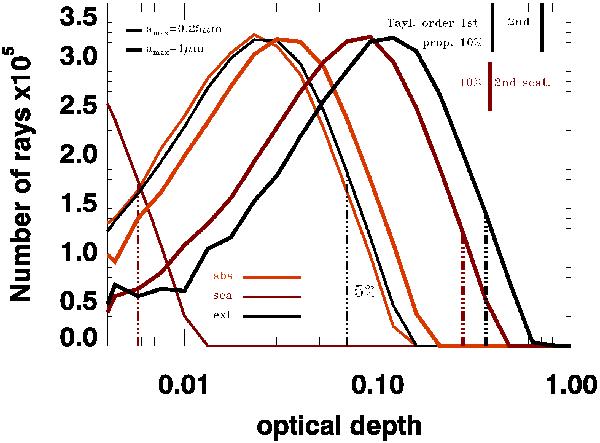
Number distribution of rays through a standard core as a function of the optical depth for absorption (red), scattering (pink), and extinction (black), respectively. The thin and thick lines correspond to MRN(0.25) and MRN(1) distributions, respectively. The dash-dotted lines give the limiting τ for which 5% of all rays have larger τ. The three vertical bars in the upper left corner indicate the τ values for which the relative error in the Taylor expansion of the extinction in first and second order reaches 10%, and the τ where the probability for second scattering reaches 10%.
Current usage metrics show cumulative count of Article Views (full-text article views including HTML views, PDF and ePub downloads, according to the available data) and Abstracts Views on Vision4Press platform.
Data correspond to usage on the plateform after 2015. The current usage metrics is available 48-96 hours after online publication and is updated daily on week days.
Initial download of the metrics may take a while.