| Issue |
A&A
Volume 563, March 2014
|
|
|---|---|---|
| Article Number | A46 | |
| Number of page(s) | 5 | |
| Section | Extragalactic astronomy | |
| DOI | https://doi.org/10.1051/0004-6361/201323051 | |
| Published online | 05 March 2014 | |
X-ray observation of ULAS J1120+0641, the most distant quasar at z = 7.08
1
INAF, Osservatorio Astronomico di Brera, via Brera 28,
20121
Milano,
Italy
e-mail:
alberto.moretti@brera.inaf.it
2
INAF, Osservatorio Astronomico di Bologna, via Ranzani 1,
40127
Bologna,
Italy
3
INAF, via E. Bassini 15, 20133
Milano,
Italy
4
Dipartimento di Astronomia, Università degli Studi di
Bologna, via Ranzani
1, 40127
Bologna,
Italy
Received: 14 November 2013
Accepted: 31 January 2014
We probe the emission mechanism of the accreting super massive black holes in the high redshift Universe and, to do this, we study the X-ray spectrum of ULAS1120+064, the highest redshift quasar detected so far at z = 7.085, which has been deeply observed (340 ks) by XMM-Newton. Despite the long integration time, the spectral analysis is limited by the poor statistics, with only 150 source counts being detected. We measured the spectrum in the 2−80 keV rest-frame (0.3−10 keV observed) energy band. Assuming a simple power law model, we find a photon index of 2.0 ± 0.3 and a luminosity of 6.7 ± 0.3 × 1044 erg s-1 in the 2−10 keV band, while the intrinsic absorbing column can only be loosely constrained (NH < 1023 cm-2). Combining our measure with published data, we calculate that the X-ray-to-optical spectral index αOX is 1.8 ± 0.1, in agreement with the αOX-UV luminosity correlation that is valid for lower redshift quasars. This is the second time that a z > 6 quasar has been investigated through a deep X-ray observation. In agreement with previous studies of z ~ 6 AGN samples, we do not find any hint of evolution in the broadband energy distribution. Indeed from our dataset, ULAS 1120+0641 is indistinguishable from the population of optically bright quasar at lower redshift.
Key words: quasars: supermassive black holes / quasars: individual: ULAS J1120+0641 / early Universe
© ESO, 2014
1. Introduction
High redshift AGNs are important probes of the Universe at the end of the dark ages before or around the time when the first stars formed. Characterizing their multiwavelength properties allows us to investigate the formation and early evolution of the super massive black holes (SMBHs) and their interaction with the host galaxies.
In the past decade, wide area optical-IR photometric surveys succeeded in finding a statistically significant number (~50) of AGNs at redshift 5.7 < z < 6.4 (Fan et al. 2006; Jiang et al. 2009; Willott et al. 2010b). Complementing these data with IR spectroscopy for a subsample of ten quasars, Willott et al. (2010a) derived the mass function at z > 6, which can be used to constrain models of SMBH evolution (Di Matteo et al. 2008; Marconi et al. 2008; Shankar et al. 2009; Volonteri 2010). Recently, Venemans et al. (2013) has discovered three z > 6.5 quasars in the optical/IR VIKING 332 deg2 survey, setting a lower limit of 1.1 Gpc-3 on the density of SMBH with mass higher than 109 M⊙ at 6.5 < z < 7.5.
Few of these high redshift sources have been studied through their X-ray emission. Three have been observed for 10−30 ks by Chandra with 5−20 photons collected for each one (Shemmer et al. 2006). For the only SDSS J1030+0524 at z = 6.3, a deep (100 ks) XMM-Newton observation has been carried out and a spectroscopic study has been reported (Farrah et al. 2004). The statistical X-ray properties of 5 < z < 6 AGNs have been studied so far only by stacking samples of several sources (Vignali et al. 2005; Shemmer et al. 2006). Overall these studies indicated that the quasar broadband energy distribution has not evolved significantly over cosmic time, at least out to z = 6. Indeed, the mean X-ray spectral slope at z > 5 is indistinguishable from the local population, while the ratio between UV and X-ray is consistent with the values observed at lower redshift.
In this paper we discuss the deep XMM-Newton observation of ULAS J1120+0641, the highest redshift quasar detected so far (z = 7.085). It has been discovered in the UK Infrared Deep Sky Survey (UKIDSS) and deeply studied by means of deep VLT and Gemini North spectroscopic observations (Mortlock et al. 2011). Starting from an absolute magnitude of M1450,AB = −26.6 ± 0.1 and using a correction of 4.4, Mortlock et al. (2011) estimates a bolometric luminosity of 2.4 × 1047 erg s-1, while the mass of the accreting black hole has been measured to be 2.0 (Mortlock et al. 2011). This implies an Eddington ratio of 1.2
 (Mortlock et al. 2011). Very recently De Rosa et al. (2013) has refined the estimate of the black hole mass and of the bolometric luminosity by means of a new VLT/X-Shooter deep observation. They measured a mass of 2.4
 and an Eddington ratio of 0.5.
ULAS J1120+0641 has been also observed in the 1−2 GHz band by Momjian et al. (2014) who set an upper limit on the ratio of the observed radio to the optical flux densities of R < 0.5−4.3 (depending on the assumed radio spectral index alpha). Therefore, irrespective of the assumed spectral index, the source J1120+0641 at z = 7.085 is a radio quiet quasar.
XMM-Newton observation log.
The very fact that a 2 × 10⁹ M⊙ black hole still exists 750 million years after the Big Bang strongly constrains the mass of the seed from which it developed, which cannot be lower than 5 × 10⁵ M⊙, unless it grew by means of thousands of merging events with massive star remnants (Willott 2011). Exploiting the detection of the [CII] emission line from the host galaxy, Venemans et al. (2012) were able to estimate the star formation rate (160−440 ⊙ yr-1), the dust mass (0.7−6 × 10⁸ Msun) and an upper limit on the dynamical mass of (3.6 × 10¹⁰(sin i)-2 M⊙). While the spectrum redward of the Lyα is almost indistinguishable from the lower redshift quasar, the blueward part implies a neutral fraction of the surrounding IGM of >0.1, which is 15 times higher than z ~ 6 (Mortlock et al. 2011; Bolton et al. 2011).
While writing this paper, another work presenting analysis of the same dataset, was posted (Page et al. 2014). We discuss the differences between their analysis and ours throughout the paper.
Throughout this paper we assume H0 = 70 km s-1 and Ωλ = 0.73 and Ωm = 0.27.
2. Data
XMM-Newton observed ULAS1120+0641 on three different orbits in the period from May 24 to June 21, 2012 for a total of 340 ks (Table 1). The data are publicly available from the XMM science archive1. EPIC data were processed and cleaned using the Science Analysis Software (SAS ver 13.0.1) and analyzed using standard software packages (FTOOLS ver. 6.13). The data were filtered for high background time intervals; for each observation and EPIC camera, we extracted the 10−12 keV light curves and filtered out the time intervals where the light curve was 2σ above the mean. For the scientific analysis we only considered events corresponding to patterns 0−12 and pattern 0−4 for the EPIC-MOS1/MOS2 and EPIC-pn, respectively. We ended up with 260.75 and 221.25 useful ks for the MOS and the PN, respectively (Table 1).
We restricted our spectral analysis to a circular region centered on the optical position of the source (RA: 11:20:01.48 Dec: 06:41:24.3) with a radius of 10′′, corresponding to 55% of the encircled energy fraction at 1.5 keV2. The background was extracted from an adjacent circular region that was ~10 times larger (Fig. 1). In the source region and in the 0.3−2.0 (0.3−10) keV observed energy band, the source is 45% and 30% (28% and 10%) of the total (source+background) signal, for the MOS and the PN, respectively, while using a wider extraction region would result in an unacceptable signal-to-background ratio. We extracted the data from the same regions for both the MOS detectors and for the PN, summing together the six MOS and the three PN spectra, respectively (together with the calibration matrices). In total the estimated source counts registered by the MOS and PN in the 0.3−10 keV band are ~86 and 71, 95% of which are below 3.0 and 2.0 keV, respectively, (Fig. 2).
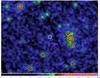 |
Fig. 1 The 4′′ kernel smoothed XMM-Newton MOS image of ULAS1120+641 region of the sky in the (observed) 0.5−2.0 keV band. The white and magenta circles show the source and background extraction regions of 10′′ and 32′′ radius, respectively. |
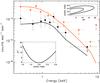 |
Fig. 2 Black and red points and lines show the MOS and PN data and models, with the relative 1σ errors. We detect significant emission up to ~3 keV. For the clarity of the plot, data are binned to have a 2σ significance in each bin. Arrows show the 2σ upper limits. In the lower inset, the Δχ2 is shown for different values of photon index. In the upper inset, the Δχ2 contour plot is shown as a function of the photon index and the NH at the 68% and 90% confidence level (for the 2 parameters of interest). |
Using Xspec version 12.7.1 (Arnaud 1996), we modeled the MOS and PN spectra with a simple absorbed power law with the absorption factor frozen to the Galactic value (5.1 × 1020 cm-2) as measured by the HI Galaxy map (Kalberla et al. 2005). Spectra were grouped, thereby ensuring a minimum of one count for each bin, and the best fit was calculated using the C-statistics. We found that the best photon index is 1.98 (errors are quoted at 68% confidence level), and the flux in the 0.5−2.0 keV band is 9.3
 erg s-1 cm-2 (Table 2).
Folding the model with an absorber at the same redshift as the source (zwabs in XSPEC), the 1σ upper limit on the intrinsic absorbing column density is 1023 cm-2. Although the redshifted iron Kα falls in a very favorable energy band (0.8 keV) both for detector energy resolution and response, we can only set a very loose 1σ upper limit of 0.92 keV (rest frame) to its equivalent width. Using the bolometric luminosity reported by Mortlock et al. (2011), 2.4 × 1047 erg s-1, yields Lbol/L[2−10] keV of 361 , where the errors only account for the luminosity uncertainties.
Best fit parameters.
Our spectral slope best fit is lower than the one reported by Page et al. (2014), who find 2.64 (1σ errors). Although the two measures differ by less than 2σ, the discrepancy is more significant considering that the measure are not independent since we used the same dataset. A possible origin of this discrepancy is the different estimates of the background. It is well known that the X-ray background cosmic variance produces an extra systematic term to be summed to the Poissonian/statistical uncertainty (Moretti et al. 2009). Moreover, the instrument component, which is a substantial fraction of the EPIC background, is not spatially uniform on the detector (Kuntz & Snowden 2008). To check our measure against its non-Poissonian variations, we repeated our analysis, varying the size and the position of the background extraction region five times. We found that the five best-fit values of the photon index are in the range 1.6−2.3 with a mean of 1.9. Therefore we cannot exclude that a different background estimate is the cause of the difference between our spectroscopic measure and the one reported by Page et al. (2014).
We note that our flux measure in the 0.5−2.0 keV band is 1.5 times (~2σ) higher than the one reported by Page et al. (2014). Since the background in the soft band is almost two times the source, this discrepancy can be explained by a 20% to 30% difference in the background normalization estimate. This, again, suggests that the probability that the difference between the two measures is due to a background fluctuation is not negligible.
ULAS1120+0641 was observed by Chandra for 15.8 ks in February 2011 (Observation-id 13203). We analyzed the processed (level 2) event file available from the Chandra science archive3. Owing to the short exposure, only four source counts have been collected in the 0.5−2.0 keV band. Assuming the spectral parameters measured by XMM-Newton, we would expect 2.8 counts in a 15.8 ks Chandra observation, consistent with the observed data. Thus, at variance with Page et al. (2014), we do not find any significant variation in the flux level of ULAS1120+0641 between the Chandra and XMM observations.
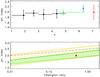 |
Fig. 3 Upper panel: photon index versus redshift. Black and green points are the results of Just et al. (2007) and Vignali et al. (2005) stacking analysis; the blue point is the photon index of SDSS J1030+05 (Farrah et al. 2004); the red point is our measure of the photon index of ULASJ1120+0641. In all cases, the assumed model is a simple power law. Lower panel: photon index versus Eddington ratio. The yellow area represents the correlation together with its scatter found by Risaliti et al. (2009), while the green shaded area is from Shemmer et al. (2008). The short and long dashed line are from Brightman et al. (2013) and Fanali et al. (2013), respectively. The red point shows the present measure of the photon index of ULASJ1120+0641, with the Eddington ratio estimate by De Rosa et al. (2013). The error bar is calculated accounting for the zero point uncertainty (0.55 dex) of the relation used to compute the BH mass (De Rosa et al. 2013). |
3. Discussion
3.1. X-ray photon index
According to the AGN standard model, X-ray photons are produced by the inverse Compton scattering of the accretion disk UV photons by the electrons in the corona (Haardt & Maraschi 1991). Therefore the X-ray spectrum can be used as a direct probe of the physical mechanisms acting very close to the black hole. In particular, the slope of the X-ray spectrum gives direct information about the energy distribution of the electrons in the corona. The typical AGN X-ray spectrum above 2 keV can be described well by a simple power law with a photon index of ~2 with a 10−20% dispersion either considering only data below 10 keV(e.g. Tozzi et al. 2006; Mainieri et al. 2007; Young et al. 2009; Corral et al. 2011) or including higher energies (e.g. Burlon et al. 2011; Rivers et al. 2013). Because several previous studies (Vignali et al. 2005; Shemmer et al. 2006; Just et al. 2007) did not find any detectable evolution of the AGN photon index change with redshift up to z ~ 5, we expect that ULAS1120+0641 photon index would be consistent with the collective properties of lower redshift populations (upper panel of Fig. 3). Indeed, the measure of 1.98 is very consistent with the typical 2.0 and a 10% to 20% scatter. The only other direct measure of a z > 6 AGN X-ray photon index is ~2.1 ± 0.1 (Farrah et al. 2004), while the stacking analysis of a sample of 24 z > 4.5 quasars yields 1.98 ± 0.2 (Vignali et al. 2005).
A relation between the Eddington ratio and X-ray spectral slope has been found by several authors using different samples (Shemmer et al. 2006; Risaliti et al. 2009; Jin et al. 2012; Fanali et al. 2013; Brightman et al. 2013); see the lower panel of Fig. 3. A plausible physical interpretation of this correlation is that, at high accretion rates, the disk emission is stronger and produces more soft photons leading to a more efficient Compton cooling of the corona and, therefore, to steeper X-ray spectra. ULAS1120+0641, with an estimated Eddington ratio of 0.5 (De Rosa et al. 2013), according to Shemmer et al. (2008), Risaliti et al. (2009), and Fanali et al. (2013), is expected to have an X-ray spectrum slope of 2.0−2.4, which is within the 1σ uncertainty of the actual measure (lower panel of Fig. 3).
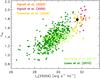 |
Fig. 4 αOX versus UV monochromatic luminosity of ULAS1120+0641(black point), compared with four different samples, both X-ray (Lusso et al. 2010; Marchese et al. 2012) and optically selected (Vignali et al. 2003b, 2005; Shemmer et al. 2006). |
3.2. X-ray and UV
The ratio between X-ray and UV-optical emission is expected to be determined by the relative importance between disk and corona. Therefore it is an important piece of information to test energy-generation models and to constrain the bolometric corrections. From a purely observational point of view, determining this ratio is mandatory for comparing the statistical properties of samples that have been selected at different wavelengths. The ratio between the UV and X-ray emission is usually parametrized by αOX4, which is the slope of the power law that joins the energy distribution at 2500 Å and 2 keV.
For ULAS1120+06 we measured a 2 keV rest-frame monochromatic luminosity of 7.8 erg s-1 Hz-1, while from the IR spectrum (Mortlock et al. 2011) we derived a 2500 Å rest-frame luminosity of 3.4 × 1031 erg s-1 Hz-1, assuming a 10% uncertainty. This yields an
  .
.
Vignali et al. (2003a), Steffen et al. (2006), and more recently, Lusso et al. (2010) found that the apparent dependence of αOX on redshift can be explained by a selection bias and confirmed that the real dependence is on the UV luminosity. Indeed, all these authors found a significant correlation between αOX and the monochromatic Lν(2500 Å) in the sense that the X-ray luminosity is relatively lower for UV brighter AGN (Fig. 4). In agreement with these results, we find that ULAS1120+06 αOX is consistent with lower redshift (4 < z < 5) optically selected bright QSO I (Vignali et al. 2003b, 2005; Steffen et al. 2006; Just et al. 2007), which have similar UV luminosities. Moreover, we find very good consistency with the extrapolation to bright UV luminosities of the LX − LUV correlation as measured in the X-ray selected AGN COSMOS (Lusso et al. 2010) and XBS (Marchese et al. 2012) samples (Fig. 4).
In agreement with what is found for the αOX parameter, we note that the value of the X-ray bolometric correction, kbol, defined as the ratio between the X-ray and bolometric luminosities (361), is consistent with the expectation for quasars at this level of X-ray loudness (Lusso et al. 2010; Marchese et al. 2012). In particular, using the relation found by Marchese et al. (2012), log (kbol) = 1.05−1.52 , we expect a bolometric correction of 387 with a 1σ scatter of 54 (corresponding to 14%), which is in very good agreement with our measure.
4. Conclusion
In this paper we report on the deep X-ray observation of the quasar ULAS1120+0641. This is the second time that the X-ray spectrum and, in particular, the direct measure of the photon index of an AGN at redshift z > 6 can be measured. We found that the X-rays contribute only 0.3% to the bolometric energy output of this source. Both the X-ray spectrum and the X-ray-to-optical spectral index are consistent with the properties of bright quasar samples optically detected at lower redshift. This suggests that the physical mechanism, which is behind the broadband emission of AGNs in the local Universe, is already active in ULAS1120+064, only 0.75 Gyr after the Big Bang.
As pointed out by De Rosa et al. (2013), the systematic uncertainties in the mass determination (0.3−0.55 dex) prevent placing robust constraints on the masses of the SMBH seeds. In this context the measure of the X-ray spectrum slope provides a useful extra piece of information since we know that this slope is related to the Eddington ratio. Our work shows that this is also the case for ULAS1120+064, for which the X-ray spectrum is consistent with the Eddington ratio independently determined from the optical spectrum.
In the past few years, wide area optical/IR photometric surveys have been able to extend the AGN studies at very high redshift well inside the reionization era, when the coevolution with their host galaxies has been settling. This has been possible thanks to the detection of very bright and rare quasars, which represent the most striking sources of the AGN population, the bulk of which is much fainter. In this context X-ray observations would be mandatory for probing the obscured accretion. However, building an X-ray selected catalog of z > 6 AGNs is beyond the capabilities of the current generation of X-ray missions, which are limited by a relatively small grasp (effective area × field of view). The wide field imager (WFI), which will be part of the scientific payload of the Athena mission (Nandra et al. 2013), recently selected as second large class mission (L2) in the Cosmic Vision program, will improve the survey velocity by two orders of magnitude with respect to Chandra. This will allow a relevant number (60) of z > 6 AGN to be detected by employing the same exposure time of the Chandra deep field, four million seconds, (Aird et al. 2013).
At the present time, X-ray follow-up observations of optically/IR selected quasars are useful, not only for calculating the bolometric luminosity and improving the accretion rate estimates, but also to test possible evolution of the physical mechanism acting very close to the SMBH. For high redshift AGNs, this is very important because the measure of the mass, together with an estimate of the accretion rates for a statistically significant sample, can provide the constrains to distinguish between different models of SMBH formation and evolution (Volonteri 2010).
http://xmm.esac.esa.int/xsa; PI: M. Page.
Acknowledgments
This work is based on observations obtained with XMM-Newton, an ESA science mission with instruments and contributions directly funded by ESA Member States and NASA. The research leading to these results has received funding from the European Commission Seventh Framework Program (FP7/2007−2013) under grant agreement No. 267251 “Astronomy Fellowships in Italy” (AstroFIt).
References
- Aird, J., Comastri, A., Brusa, M., et al. 2013 [arXiv:1306.2325] [Google Scholar]
- Arnaud, K. A. 1996, in Astronomical Data Analysis Software and Systems V, eds. G. H. Jacoby, & J. Barnes, ASP Conf. Ser., 101, 17 [Google Scholar]
- Bolton, J. S., Haehnelt, M. G., Warren, S. J., et al. 2011, MNRAS, 416, L70 [NASA ADS] [CrossRef] [Google Scholar]
- Brightman, M., Silverman, J. D., Mainieri, V., et al. 2013, MNRAS, 433, 2485 [NASA ADS] [CrossRef] [Google Scholar]
- Burlon, D., Ajello, M., Greiner, J., et al. 2011, ApJ, 728, 58 [NASA ADS] [CrossRef] [Google Scholar]
- Corral, A., Della Ceca, R., Caccianiga, A., et al. 2011, A&A, 530, A42 [NASA ADS] [CrossRef] [EDP Sciences] [Google Scholar]
- De Rosa, G., Venemans, B. P., Decarli, R., et al. 2013, ApJ, submitted [arXiv:1311.3260] [Google Scholar]
- Di Matteo, T., Colberg, J., Springel, V., Hernquist, L., & Sijacki, D. 2008, ApJ, 676, 33 [NASA ADS] [CrossRef] [Google Scholar]
- Fan, X., Strauss, M. A., Becker, R. H., et al. 2006, AJ, 132, 117 [NASA ADS] [CrossRef] [EDP Sciences] [Google Scholar]
- Fanali, R., Caccianiga, A., Severgnini, P., et al. 2013, MNRAS, 433, 648 [NASA ADS] [CrossRef] [Google Scholar]
- Farrah, D., Priddey, R., Wilman, R., Haehnelt, M., & McMahon, R. 2004, ApJ, 611, L13 [NASA ADS] [CrossRef] [Google Scholar]
- Haardt, F., & Maraschi, L. 1991, ApJ, 380, L51 [NASA ADS] [CrossRef] [Google Scholar]
- Jiang, L., Fan, X., Bian, F., et al. 2009, AJ, 138, 305 [NASA ADS] [CrossRef] [Google Scholar]
- Jin, C., Ward, M., & Done, C. 2012, MNRAS, 425, 907 [NASA ADS] [CrossRef] [Google Scholar]
- Just, D. W., Brandt, W. N., Shemmer, O., et al. 2007, ApJ, 665, 1004 [Google Scholar]
- Kalberla, P. M. W., Burton, W. B., Hartmann, D., et al. 2005, A&A, 440, 775 [NASA ADS] [CrossRef] [EDP Sciences] [Google Scholar]
- Kuntz, K. D., & Snowden, S. L. 2008, A&A, 478, 575 [NASA ADS] [CrossRef] [EDP Sciences] [Google Scholar]
- Lusso, E., Comastri, A., Vignali, C., et al. 2010, A&A, 512, A34 [NASA ADS] [CrossRef] [EDP Sciences] [Google Scholar]
- Mainieri, V., Hasinger, G., Cappelluti, N., et al. 2007, ApJS, 172, 368 [NASA ADS] [CrossRef] [Google Scholar]
- Marchese, E., Della Ceca, R., Caccianiga, A., et al. 2012, A&A, 539, A48 [NASA ADS] [CrossRef] [EDP Sciences] [Google Scholar]
- Marconi, A., Axon, D. J., Maiolino, R., et al. 2008, ApJ, 678, 693 [NASA ADS] [CrossRef] [Google Scholar]
- Momjian, E., Carilli, C. L., Walter, F., & Venemans, B. 2014, AJ, 147, 6 [NASA ADS] [CrossRef] [Google Scholar]
- Moretti, A., Pagani, C., Cusumano, G., et al. 2009, A&A, 493, 501 [NASA ADS] [CrossRef] [EDP Sciences] [Google Scholar]
- Mortlock, D. J., Warren, S. J., Venemans, B. P., et al. 2011, Nature, 474, 616 [NASA ADS] [CrossRef] [PubMed] [Google Scholar]
- Nandra, K., Barret, D., Barcons, X., et al. 2013 [arXiv:1306.2307] [Google Scholar]
- Page, M. J., Simpson, C., Mortlock, D. J., et al. 2014, MNRAS, accepted [arXiv:1311.1686] [Google Scholar]
- Risaliti, G., Young, M., & Elvis, M. 2009, ApJ, 700, L6 [NASA ADS] [CrossRef] [Google Scholar]
- Rivers, E., Markowitz, A., & Rothschild, R. 2013, ApJ, 772, 114 [NASA ADS] [CrossRef] [Google Scholar]
- Shankar, F., Weinberg, D. H., & Miralda-Escudé, J. 2009, ApJ, 690, 20 [NASA ADS] [CrossRef] [Google Scholar]
- Shemmer, O., Brandt, W. N., Schneider, D. P., et al. 2006, ApJ, 644, 86 [NASA ADS] [CrossRef] [Google Scholar]
- Shemmer, O., Brandt, W. N., Netzer, H., Maiolino, R., & Kaspi, S. 2008, ApJ, 682, 81 [NASA ADS] [CrossRef] [Google Scholar]
- Steffen, A. T., Strateva, I., Brandt, W. N., et al. 2006, AJ, 131, 2826 [NASA ADS] [CrossRef] [Google Scholar]
- Tozzi, P., Gilli, R., Mainieri, V., et al. 2006, A&A, 451, 457 [NASA ADS] [CrossRef] [EDP Sciences] [Google Scholar]
- Venemans, B. P., McMahon, R. G., Walter, F., et al. 2012, ApJ, 751, L25 [Google Scholar]
- Venemans, B. P., Findlay, J. R., Sutherland, W. J., et al. 2013, ApJ, 779, 24 [NASA ADS] [CrossRef] [Google Scholar]
- Vignali, C., Brandt, W. N., & Schneider, D. P. 2003a, AJ, 125, 433 [NASA ADS] [CrossRef] [Google Scholar]
- Vignali, C., Brandt, W. N., Schneider, D. P., Garmire, G. P., & Kaspi, S. 2003b, AJ, 125, 418 [NASA ADS] [CrossRef] [Google Scholar]
- Vignali, C., Brandt, W. N., Schneider, D. P., & Kaspi, S. 2005, AJ, 129, 2519 [NASA ADS] [CrossRef] [Google Scholar]
- Volonteri, M. 2010, A&ARv, 18, 279 [NASA ADS] [CrossRef] [Google Scholar]
- Willott, C. 2011, Nature, 474, 583 [NASA ADS] [CrossRef] [Google Scholar]
- Willott, C. J., Albert, L., Arzoumanian, D., et al. 2010a, AJ, 140, 546 [NASA ADS] [CrossRef] [Google Scholar]
- Willott, C. J., Delorme, P., Reylé, C., et al. 2010b, AJ, 139, 906 [NASA ADS] [CrossRef] [Google Scholar]
- Young, M., Elvis, M., & Risaliti, G. 2009, ApJS, 183, 17 [NASA ADS] [CrossRef] [Google Scholar]
All Tables
All Figures
|
Fig. 1 The 4′′ kernel smoothed XMM-Newton MOS image of ULAS1120+641 region of the sky in the (observed) 0.5−2.0 keV band. The white and magenta circles show the source and background extraction regions of 10′′ and 32′′ radius, respectively. |
| In the text | |
|
Fig. 2 Black and red points and lines show the MOS and PN data and models, with the relative 1σ errors. We detect significant emission up to ~3 keV. For the clarity of the plot, data are binned to have a 2σ significance in each bin. Arrows show the 2σ upper limits. In the lower inset, the Δχ2 is shown for different values of photon index. In the upper inset, the Δχ2 contour plot is shown as a function of the photon index and the NH at the 68% and 90% confidence level (for the 2 parameters of interest). |
| In the text | |
|
Fig. 3 Upper panel: photon index versus redshift. Black and green points are the results of Just et al. (2007) and Vignali et al. (2005) stacking analysis; the blue point is the photon index of SDSS J1030+05 (Farrah et al. 2004); the red point is our measure of the photon index of ULASJ1120+0641. In all cases, the assumed model is a simple power law. Lower panel: photon index versus Eddington ratio. The yellow area represents the correlation together with its scatter found by Risaliti et al. (2009), while the green shaded area is from Shemmer et al. (2008). The short and long dashed line are from Brightman et al. (2013) and Fanali et al. (2013), respectively. The red point shows the present measure of the photon index of ULASJ1120+0641, with the Eddington ratio estimate by De Rosa et al. (2013). The error bar is calculated accounting for the zero point uncertainty (0.55 dex) of the relation used to compute the BH mass (De Rosa et al. 2013). |
| In the text | |
|
Fig. 4 αOX versus UV monochromatic luminosity of ULAS1120+0641(black point), compared with four different samples, both X-ray (Lusso et al. 2010; Marchese et al. 2012) and optically selected (Vignali et al. 2003b, 2005; Shemmer et al. 2006). |
| In the text | |
Current usage metrics show cumulative count of Article Views (full-text article views including HTML views, PDF and ePub downloads, according to the available data) and Abstracts Views on Vision4Press platform.
Data correspond to usage on the plateform after 2015. The current usage metrics is available 48-96 hours after online publication and is updated daily on week days.
Initial download of the metrics may take a while.