Fig. 2
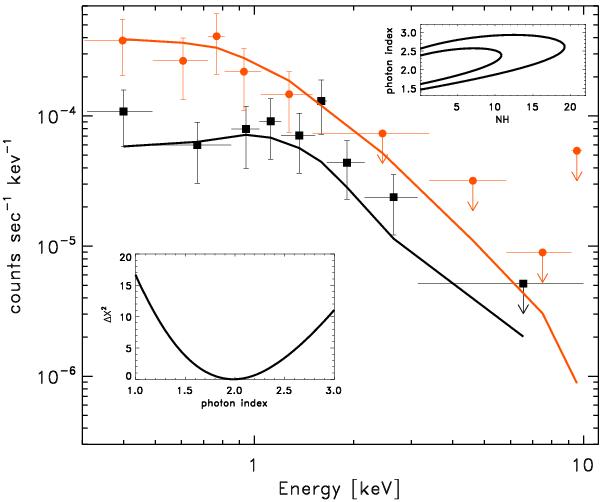
Black and red points and lines show the MOS and PN data and models, with the relative 1σ errors. We detect significant emission up to ~3 keV. For the clarity of the plot, data are binned to have a 2σ significance in each bin. Arrows show the 2σ upper limits. In the lower inset, the Δχ2 is shown for different values of photon index. In the upper inset, the Δχ2 contour plot is shown as a function of the photon index and the NH at the 68% and 90% confidence level (for the 2 parameters of interest).
Current usage metrics show cumulative count of Article Views (full-text article views including HTML views, PDF and ePub downloads, according to the available data) and Abstracts Views on Vision4Press platform.
Data correspond to usage on the plateform after 2015. The current usage metrics is available 48-96 hours after online publication and is updated daily on week days.
Initial download of the metrics may take a while.