Fig. 3
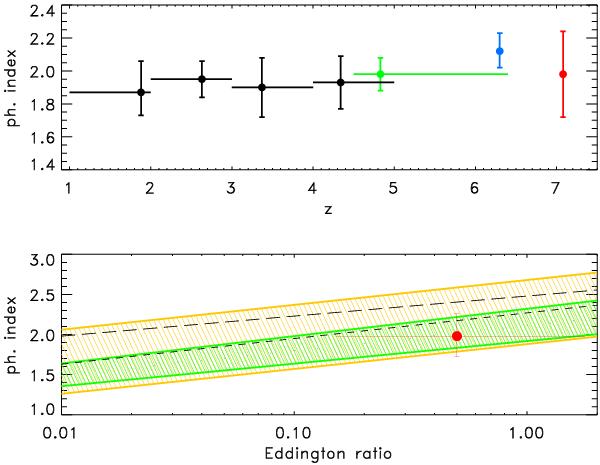
Upper panel: photon index versus redshift. Black and green points are the results of Just et al. (2007) and Vignali et al. (2005) stacking analysis; the blue point is the photon index of SDSS J1030+05 (Farrah et al. 2004); the red point is our measure of the photon index of ULASJ1120+0641. In all cases, the assumed model is a simple power law. Lower panel: photon index versus Eddington ratio. The yellow area represents the correlation together with its scatter found by Risaliti et al. (2009), while the green shaded area is from Shemmer et al. (2008). The short and long dashed line are from Brightman et al. (2013) and Fanali et al. (2013), respectively. The red point shows the present measure of the photon index of ULASJ1120+0641, with the Eddington ratio estimate by De Rosa et al. (2013). The error bar is calculated accounting for the zero point uncertainty (0.55 dex) of the relation used to compute the BH mass (De Rosa et al. 2013).
Current usage metrics show cumulative count of Article Views (full-text article views including HTML views, PDF and ePub downloads, according to the available data) and Abstracts Views on Vision4Press platform.
Data correspond to usage on the plateform after 2015. The current usage metrics is available 48-96 hours after online publication and is updated daily on week days.
Initial download of the metrics may take a while.