| Issue |
A&A
Volume 563, March 2014
|
|
|---|---|---|
| Article Number | A63 | |
| Number of page(s) | 11 | |
| Section | Interstellar and circumstellar matter | |
| DOI | https://doi.org/10.1051/0004-6361/201322500 | |
| Published online | 10 March 2014 | |
Discovery of new low-excitation planetary nebulae⋆
Department of Physics, University of Hong Kong, Pokfulam Road, Hong Kong, PR China
e-mail: This email address is being protected from spambots. You need JavaScript enabled to view it.
Received: 19 August 2013
Accepted: 2 January 2014
Abstract
We report a multi-wavelength study of four new planetary nebula (PN) candidates selected from the INT/WFC Photometric Hα Survey of the Northern Galactic Plane (IPHAS) and Deep Sky Hunter (DSH) catalogues. We present mid-resolution optical spectra of these PNs. The PN status of our sample was confirmed by optical narrow-band images and mid-resolution spectra. Based on the locations of these objects in the log(Hα/[N ii]) versus log(Hα/[S ii]) diagnostic diagram, we conclude that these sources are evolved low-excitation PNs. The optical and infrared appearances of these newly discovered PNs are discussed. Three of the new nebulae studied here are detected in infrared and have low infrared-to-radio flux ratios, probably suggesting that they are evolved. Furthermore, we derive the dynamical ages and distances of these nebulae and study the spectral energy distribution for one of them with extensive infrared archival data.
Key words: surveys / planetary nebulae: general / stars: AGB and post-AGB
Reduced imaging and spectroscopic data are only available at the CDS via anonymous ftp to cdsarc.u-strasbg.fr (130.79.128.5) or via http://cdsarc.u-strasbg.fr/viz-bin/qcat?J/A+A/563/A63
© ESO, 2014
1. Introduction
Planetary nebulae (PNs) are the evolutionary end products of low- and intermediate-mass (1 ~ 8 M⊙) stars. The number of PNs detected in the Milky Way is about 2700, although the total population of PN is believed to be about one order of magnitude higher. The list of detected PNs includes ~1500 in the Galactic PN Catalogue of Kohoutek (2001) and ~1200 PNs listed in the Macquarie-AAO-Strasbourg Hα Catalogue of Galactic PNs (MASH; Parker et al. 2006; Miszalski et al. 2008). The discrepancy between the detected and expected numbers of PNs in the Galaxy is believed to be primarily due to dust extinction, as most of the PNs are in the Galactic plane. Many evolved PNs have low surface brightness and can be easily missed in the optical surveys.
Summary of imaging observations.
Summary of spectroscopic observations.
In this paper, we present a study of four highly obscured PN candidates that are located within both regions of the INT/WFC Photometric Hα Survey of the Northern Galactic Plane (IPHAS; Drew et al. 2005)/Deep Sky Hunter (DSH) and the Spitzer Galactic Legacy Infrared Mid-Plane Survey Extraordinaire (GLIMPSE)/Wide-field Infrared Survey Explorer (WISE) infrared surveys. The sample is selected from a catalogue of 781 new PN candidates observed by IPHAS (Viironen et al. 2009a) and a list of 36 un-catalogued Galactic nebulae observed from Digitized Sky Survey (DSS) and Two Micron All Sky Survey (2MASS) surveys (Kronberger et al. 2006). Almost all of these objects are located close to the Galactic plane and are very low-brightness nebulae, indicating that they may have high dynamic ages or/and suffer larger interstellar extinction.
One of the scientific goals of the IPHAS is searching for PNs with low surface brightness or faint extended nebulae (Mampaso et al. 2006; Sabin et al. 2010). The IPHAS has mapped all northern Galactic plane coverage to  by three filters using the Wide Field Camera (WFC) on the 2.5 m Isaac Newton Telescope (INT) at the Observatorio del Roque de los Muchachos (La Palma, Spain; Drew et al. 2005). The spatial resolution of each image is 0.̋33 and the total area of the survey covers ~1800 deg2. Two broadband Sloan filters (r′ and i′) and one narrow-band Hα filter (λc = 6568 Å, Δλ = 95 Å) were used with corresponding exposure times of 30, 10, and 120 s, respectively. The measured magnitude range for point sources in the survey is r′ ~ 13 to 22 mag. The survey provides us an opportunity to obtain better estimates of Galactic PN population, the PN distribution density, the PN formation rate, and the chemical abundance of the Galaxy. Until now, a number of new PNs (Viironen et al. 2009b; Sabin et al. 2010, 2011) have been discovered based on results from this survey.
The DSH project is a group involving many amateur astronomers with the goal of discovering new nebulae by searching optical and near-infrared archival data (Kronberger et al. 2006; Jacoby et al. 2010).
Although the ionized structures of PNs are well determined by the optical observations, many faint evolved Galactic PNs suffer from high extinction, making them difficult to detect in the optical wavelengths. Unlike optical observations, infrared observations are hardly affected by dust extinction and therefore can much more effectively detect PNs. The recent infrared observations of Spitzer GLIMPSE (Benjamin et al. 2003; Churchwell et al. 2009) and the WISE (Wright et al. 2010) have made possible new ways to study Galactic PNs (e.g. Cohen et al. 2005). These results show that the optical appearances of PNs and their infrared counterparts may differ, and the infrared images can also help us to understand the distributions of dust components.
The main aim of this present work is to identify the nature of four new IPHAS/DSH PNs by the narrow-band imaging and follow-up spectroscopic observations. The observations and data reductions are described in Sect. 2. In Sect. 3, we present the results of imaging and spectroscopy in the visible and mid-infrared for these objects. The log (Hα/[N ii]) versus log (Hα/[S ii]) diagnostic diagram is discussed in Sect. 4. In Sect. 5, we present the study of spectral energy distribution for one of the new PNs. The dynamical ages and distances of these nebulae are discussed in Sect. 6. Finally, the conclusions are given in Sect. 7.
2. Observations and data reduction
Our sample consists of four objects (DSH J1941.3+2430, IPHASX J194226.1+214522, IPHASX J195248.8+255359, and IPHASX J232713.1+650923) selected from the DSH and IPHAS surveys as PN candidates. Then, they are abbreviated as PN1, PN2, PN3, and PN4, respectively, in the following sections.
2.1. BFOSC narrow-band imaging
Imaging observations were performed at the 2.16 m Telescope on the Xing-Long station of the National Astronomy Observatories of China (NAOC) on the nights of 2010 August 14–16. The BAO Faint Object Spectrograph and Camera (BFOSC) with a 1242 × 1152 CCD was used. The field of view (FOV) of the detector is 9.́3 × 8.́6 with a pixel scale of 0.̋45. Our sample objects were imaged with two narrow-band filters: [O iii] (λc = 5009 Å, Δλ = 120 Å) and Hα+[N ii] (λc = 6562 Å, Δλ = 140 Å). The exposure times for these objects ranged from 1800 to 3600 s. The seeing conditions during the observing run varied between 1.̋8 and 2.̋3. The data were processed through the IRAF software package calibration. Standard bias subtraction and flat-field correction were performed. Data were taken in two-step dithered positions to enhance spatial sampling and cosmic rays removal. The journal of observations is summarised in Table 1.
2.2. OMR optical spectroscopy
Mid-resolution spectra of these sources were also obtained by the 2.16 m telescope of NAOC. An Optomechanics Research Inc. (OMR) spectrograph and a PI 1340 × 400 CCD were used, which result in a spectral dispersion of ~2.0 Å pixel-1. The spectral coverage of the observations is from 4750 to 7450 Å at a resolution of 11 Å FWHM. The seeing conditions varied from 2.̋0 and 2.̋2 during the observing run. A slit width of 3.̋6 was set through the main nebulae off the geometric centres to avoid possible contamination from the central stars. The length of long slit is 4′ and was placed along the north-south direction. Due to the instrumental limitation, the long slit was not rotated to the parallactic angle, tending to lead to flux losses caused by atmospheric dispersion (Filippenko 1982). However, the effect is negligible, since the slit width is large for our observations, and the objects were observed when they were close to the meridian. The exposure times ranged from 6400 to 10 000 s. Exposures of He-Ar arcs were obtained right before and after each spectrum of standard star and used for the wavelength calibration.
Data were reduced following standard procedures in the NOAO IRAF V2.14 software package. The CCD reductions included bias and flat-field correction, background subtraction, and cosmic-ray removal. Flux calibration was derived from observations of at least three of the KPNO standard stars per night. The standard stars HR 7059, HR 7596, and HR 9087 were used for flux calibration. The atmospheric extinction was corrected by the mean extinction coefficients measured for Xing-Long station, where the 2.16 m Telescope is located. A final spectrum for each object was produced using the co-added separate exposures to improve the signal-to-noise ratio and a summary of spectroscopic observations is given in Table 2.
All line fluxes of these objects were measured using Gaussian line profile fitting. The uncertainties in fluxes are obtained from the noise level in the continuum. If we take into account the uncertainties of absolute flux calibrations and line flux measurements, the flux errors are estimated to be about 15%–30%.
2.3. Spitzer GLIMPSE and MIPSGAL data
Infrared images surrounding the sample objects were extracted from the Spitzer GLIMPSE I survey. The GLIMPSE I survey mapped most of the inner Galactic plane at mid-infrared 3.6, 4.5, 5.8, and 8.0 μm using the Infrared Array Camera (IRAC; Fazio et al. 2004), which covers a Galactic region of | l | = 10°–65° and  (total area ~220 deg2). The angular resolutions of the IRAC camera in these four infrared bands were from 1.̋6 to 1.̋8 with a field of view of ~5.́2 × 5.́2. The observations were obtained with two 2 s exposures at each position during the periods between 2004 March and 2004 November. The basic data processing performed by the Spitzer Science Center (SSC) consists of correction for instrumental artifacts, determination of the flux densities and positions of point sources, and final mosaic the images. The GLIMPSE I data yield various products including mosaic images covering the survey area, a high reliable GLIMPSE Point-Source Catalog (GLMC), and a more complete GLIMPSE Point-Source Archive (GLMA).
Three out of the four nebulae (PN1, PN2, and PN3) in our sample are found to lay within the GLIMPSE I area. Their integrated fluxes in each band were measured using the method described in Kwok et al. (2008) and Zhang et al. (2012). Two individual square apertures of the same size were used to measure the on-nebula (Fn) and background (Fb) fluxes. To reduce the measuremental errors, we measured the fluxes using the same apertures with different background positions for each target (the used apertures depend on the apparent sizes of these nebulae seen in the images), and then the adopted values were obtained from the average of all measurements. In all four IRAC images, the apertures were put in the identical positions in each frame. Then the sum of all the fluxes of sources in the point-source archive within each aperture were obtained (Fn,p and Fb,p) and subtracted from Fn and Fb, respectively. The total fluxes of these three nebulae were obtained from the difference between (Fn − Fn,p) and (Fb − Fb,p). Due to relatively large sizes for our objects (>16″), the extended source aperture calibrations must be made using the correction factors (Reach et al. 2005) suggested by Jarrett1.
The PN1, PN2, and PN3 are also detected by the Multiband Imaging Photometer for Spitzer (MIPS; Rieke et al. 2004) in the Spitzer Legacy program MIPS Inner Galactic Plane Survey2 (MIPSGAL). The MIPSGAL observations were taken from different epochs between 2005 and 2006 and produced 24 and 70 μm imaging with an area of 278 deg2, which is located in the inner Galactic plane ( and
and  ). In this study, we only used the available 24 μm images of the same regions for our sample (PN4 does not lay within the MIPSGAL field). The 24 μm fluxes are determined using the same method as described above. The aperture calibrations of these three objects at 24 μm vary in different source colours and apparent sizes. We have corrected the fluxes using the calibration factors suggested by MIPS Instrument Handbook3.
The photometric uncertainties of flux measurements in these bands are estimated to be ~14%, 17%, 18%, 12%, and 9% for 3.6, 4.5, 5.8, 8.0, and 24 μm, respectively. These values of the uncertainties are derived from the standard deviations of flux determinations associated with our aperture photometry method, which are dominated by the uncertainties due to background substraction.
Spitzer and WISE observations.
Other flux measurements.
2.4. WISE data
The WISE mission has mapped the sky in four bands at 3.4, 4.6, 12, and 22 μm with resolutions from 6.̋1 to 12″. The preliminary data release includes the first 105 days of mission from 14 January 2010 to 29 April 2010, which covers about 57% of all sky. All the nebulae are located within the area of preliminary data4, but the infrared counterpart of PN4 is too faint to be detected by WISE. All four bands were imaged simultaneously, and the exposure times were 7.7 s in 3.4 and 4.6 μm and 8.8 s in 12 and 22 μm. The data presented here were processed with initial calibrations and reduction algorithms. The primary release data products include 10,464 calibrated, mosaic images, a highly reliable Point-Source Catalog containing over 257 million objects detected on the WISE images, and an extra moving object supplement that provides the positional information of asteroids, comets, and planetary satellites.
Although the WISE 3.4 and 4.6 μm bands are similar to IRAC 3.6 and 4.5 μm channels, the wavelength range of the 3.4 μm band is slightly bluer compared to IRAC 3.6 μm channel and 4.6 μm band is slightly redder compared to IRAC 4.5 μm band. The WISE 12 μm band is more sensitive than the IRAC 8 μm channel because the WISE 12 μm passband is significantly broader than that of the IRAC 8 μm band. The aromatic infrared band (AIB) features at 7.7, 8.6, 11.3, 12.7, and 16.4 μm are covered in the WISE 12 μm band, but only the first two features lie within the IRAC 8 μm band. Both filters cover a number of nebular atomic emission lines. The WISE 22 μm band is less affected by saturation problems compared to the MIPS 24 μm band because the saturation for point sources at 22 μm band is ~12.4 Jy, which is higher than that at MIPS 24 μm band saturation value of 2 Jy (see WISE explanatory supplement5).
We perform aperture photometry for all nebulae in our sample using the phot task in the APPHOT package of IRAF software (ver. 2.14). The field stars close to the objects for each band were removed. Then the local background estimations and total flux measurements for each source per band were obtained. For each band, the photometry was performed five times with different background positions, resulting in a standard deviation of flux. The deviations may be high if the nebulae lay within the fields with non-uniform background emissions or they have non-circular shapes (circular apertures were used when carrying out the photometry), and vice versa. To estimate the uncertainties in flux, we adopt the standard deviations of all background-subtracted flux measurements. The most influenced bands in our WISE observations are 12 and 22 μm channels, and the characteristic uncertainties of all flux measurements are estimated to be ~18%, 17%, 18%, and 19% for 3.4, 4.6, 12, and 22 μm, respectively. The Spitzer and WISE infrared photometric results of these PNs are given in Table 3.
2.5. Other infrared data
The archival data from the 2MASS (Skrutskie et al. 2006), Infrared Astronomical Satellite (IRAS; Neugebauer et al. 1984), and AKARI Infrared Astronomical Mission (Murakami et al. 2007) were also used. All of them mapped entire sky covering the wavelength range from near-infrared to far-infrared. The 2MASS survey scanned all objects in three bands at J (1.25 μm), H (1.65 μm), and Ks (2.17 μm) and obtained 4, 121, 439 FITS images with the pixel size of ~2.̋0. The 2MASS Point Source Catalogue (Cutri et al. 2003) was produced using these images and cataloged 470, 992, 970 sources. The IRAS survey was the first infrared observatory to detect point sources in four broadbands at 12, 25, 60, and 100 μm with resolutions from 30″ (12 μm) to 2′ (100 μm). One of the primary products of IRAS observation was the point source catalogue (PSC), which contained ~246 000 point sources. The AKARI mission had carried out an all-sky survey in two mid-infrared bands centred at 9 and 18 μm and four far-infrared channels centred at 65, 90, 140 and 160 μm. The angular resolutions of the images in these bands were from 2.̋34 to 44.̋2 pixel-1. The primary product of this survey was the point source catalogue, which contained ~0.9 million objects that were clearly resolved by the infrared astronomical satellite. These archival infrared measurements of the nebulae are given in Table 4.
2.6. Radio data
Most PNs are weak radio continuum sources due to free-free emissions from their ionized components. We made use of the 1.4 GHz radio fluxes from the National Radio Astronomy Observatory (NRAO) Very Large Array (VLA) Sky Survey (NVSS; Condon & Kaplan 1998). All four PNs can be detected in the NVSS radio survey. The NVSS covers most of the entire sky ( ) with a sensitivity of ~2.5 mJy beam-1 at 1.4 GHz, which provides a spatial resolution of 45″, so that all objects in our sample can not be spatially resolved by NVSS.
3. Results for new planetary nebulae
Results from the imaging, spectroscopic, and photometric studies in the visible, infrared, and radio of these four new PNs are presented below.
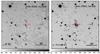 |
Fig. 1 Images of DSH J1941.3+2430 (PN1) in [O iii] (left) and Hα+[N ii] (right) displayed on a linear intensity scale. North is up and east is to the left. The gray-scale bar is given at the bottom in units of counts per pixel. The position of this PN is marked with the red central cross. |
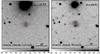 |
Fig. 2 Images of IPHASX J194226.1+214522 (PN2) in [O iii] (left) and Hα+[N ii] (right) displayed on a linear intensity scale. North is up and east towards the left. The gray-scale bar is given at the bottom in units of counts per pixel. The position of PN2 is marked with the red central cross. |
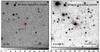 |
Fig. 3 [O iii] (left) and Hα+[N ii] (right) images of IPHASX J195248.8+255359 (PN3) displayed on a logarithmic intensity scale to show the outer lobes of the nebula. North is up and east is to the left. The gray-scale bar is given at the bottom in units of counts per pixel. The position of PN3 is marked with the red central cross. |
3.1. Morphology
The locations of all nebulae in our sample are close to the Galactic plane, which is also where diffuse H ii regions, supernova remnants (SNRs), star-forming complexes, and other nebulous objects are located. To confirm the PN nature of the candidates, it would be useful for obtaining narrow-band optical images of the surrounding environment of the objects.
In Figs. 1–4, we show the narrow-band ([O iii] and Hα+[N ii]) images of the sample objects. All are well resolved and show distinct morphologies. Their central stars are neither detected nor are very faint in the visible. Two nebulae (PN2 and PN3) show bipolar morphology, one (PN4) with round shape and another one (PN1) with irregular structures in the Hα+[N ii] images. The nebulae PN2 and PN4 all show similar appearances in both [O iii] and Hα+[N ii] images, whereas PN3 only reveals the brighter central core in the [O iii] image.
The nebula PN1 was first detected as a PN candidate by Kronberger et al. (2006) based on DSS optical imaging and 2MASS observations. Our Hα+[N ii] image shows a pair of irregular nebular knots extending ~10″ towards northeast – southwest direction in Fig. 1. No [O iii] emission is detected associated with this source.
PN2 shows a bright, filled, central waist with two faint bipolar outer lobes (Fig. 2). The major axis of the lobes is oriented at position angle (PA) = 93° and has a length of 16″× 12″ in [O iii] and 23″× 16″ in Hα+[N ii].
PN3 has a typical morphology of a bipolar PN. It has a bright unresolved core and a pair of faint extended bipolar lobes (Fig. 3). The extended bipolar lobes are only visible in the Hα+[N ii] image but not in the [O iii] image. The major axis of the bipolar lobes has a position angle of 49° and the nebula has projected sizes of 6.̋5 in [O iii] and 26 5 in Hα+[N ii], respectively.
Both the [O iii] and Hα+[N ii] images of PN4 reveal a round appearance (Fig. 4). The Hα+[N ii] appearance is clearly more extended than its [O iii] counterpart. The nebula has a typical round shape with a central cavity and has a diameter of 18″ in Hα+[N ii] and 15″ in [O iii].
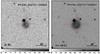 |
Fig. 4 Images of IPHASX J232713.1+650923 (PN4) in [O iii] (left) and Hα+[N ii] (right) displayed on a linear intensity scale. North is up and east is to the left. The gray scale bar is given at the bottom in units of counts per pixel. The position of PN4 is marked with the red central cross. |
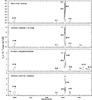 |
Fig. 5 Optical spectra of the four sample PNs in the wavelength range of 4800 Å to 7400 Å. The prominent emission features are marked. |
3.2. Spectral properties
Figure 5 shows the OMR spectra of the four sample objects. All the nebulae show typical emission lines ([O iii] λλ5007, 4959, Hα, and [N ii] λλ6548, 6584) of general PNs, confirming the PN nature of these objects. The measured emission line fluxes in the spectra are listed in Table 5. The central wavelengths of the emissions and line identifications are listed in Cols. 1 and 2. Columns 3–6 give the observed fluxes (normalized to F(Hα) = 100) measured using the Gaussian fitting routine for these objects. Column 7 gives the dereddened flux for PN4, the only PN for which we could measure the Hβ line. The raw integrated Hα fluxes measured from main nebulae for PN1, PN2, PN3, and PN4 are 6.23 × 10⁻¹⁵, 1.46 × 10⁻¹⁴, 9.97 × 10⁻¹⁴, and 3.51 × 10⁻¹⁴ erg cm-2 s-1, respectively. By comparing the observed Hβ/Hα intensity ratio with the theoretical value at Te = 104 K and ne = 104 cm-3 (Hummer & Storey 1987) and by using the reddening law of Howarth (1983) for RV = 3.0, we can derive the extinction coefficient cHβ = 1.63 ± 1.01 for PN4. Although Hβ lines are not detected in PNs 1-3, a 3σ lower limit of extinction value can be estimated: F(Hα)/F(Hβ) > 10.6, giving E(B − V) > 1.39. Therefore, all the PNs are highly obscured. The line ratios of [O iii] λ5007/λ4959 of all the objects are in the range of 2.7 to 3.2, and [N ii] λ6584/λ6548 in the range of 2.8 to 3.3, which in good agreement with the theoretical predictions (e.g. Storey & Zeippen 2000). The emissions of He i at λλ7065, 7281 Å and the intermediate excitation line [Ar iii] at λ7135 Å can only be seen in PN3. Using the [S ii] λ6731/λ6717 line ratios and assuming an electron temperature Te = 10 000 K, we derive the electron densities log  , 3.43
 , 2.60
 , and 2.48
 cm-3 for PN1, PN2, PN3, and PN4, respectively.
Measured (Fλ) and dereddened ( ) emission line fluxes.
3.3. Infrared properties
To investigate the dust properties of these PNs, we have made use of infrared data from the Spitzer and WISE data archives. Three of our objects are in both of the GLIMPSE/MIPSGAL and WISE fields, and all of them have obvious infrared counterparts. The IRAC images of these three nebulae are displayed in Fig. 6. The infrared images show that these PNs are clearly much redder than the field stars, suggesting that they are dusty or reveal infrared emission features, such as AIBs, hydrogen lines, and fine-structure lines. We also note that the larger PNs show lower infrared surface brightnesses compared to that with smaller ones. The nebula PN1 clearly shows a bipolar/elliptical shape in the infrared while its optical morphology is different. Except for the bipolar/elliptical PN1, the infrared and optical morphologies of these objects appear to be similar. The IRAC images of PN2 and PN3 both clearly show prominent infrared emissions in the central dust torus/core and a pair of faint lobes, which suggest that most dust masses of these PNs are located in the central parts. The bipolar lobes of PN2 and PN3 can be only been seen at 8 μm.
The MIPS and WISE detectors have different sensitivities, and the filters have different bandpasses. Both bands have similar spectral coverage. We examine the reliabilities of flux calibration and measurement for new PNs in our sample by comparing the MIPS 24 μm and WISE 22 μm integrated fluxes. We obtain the WISE 22 μm/MIPS 24 μm flux ratio of 0.75 ± 0.14, which is in reasonable agreement with the previous results deduced by Anderson et al. (2012) (1.01 ± 0.23).
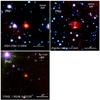 |
Fig. 6 Colour composite of the Spitzer IRAC images of PN1, PN2, and PN3. They are displayed on a logarithmic scale. These infrared images were made from three IRAC bands: 3.6 μm (shown as blue), 4.5 μm (green), and 8.0 μm (red). North is up and east is to the left. The central star of IPHASX J194226.1+214522 (PN2) can be seen in the IRAC image. |
3.4. Comparison with mid-infrared and radio flux densities
The observed mid-infrared emissions from PNs originate in circumstellar dust components heated by ultraviolet and visible photons from the central stars, whereas the thermal radio continuum originate in the ionized gas nebulae photoionized by Lyman-continuum photons from the central stars. As the central star evolves, the ratio of Lyman continuum to sub-Lyman continuum photons increases with time. It is therefore expected that the infrared to radio flux ratio will also change as the PN evolves (Cohen et al. 2007; Kwok 1989; Ortiz et al. 2011). Cohen et al. (2007) found that the infrared-to-radio flux ratio progressively declines with PN evolution. However, their subsequent study (Cohen et al. 2011) does not support the previous conclusion. Cohen et al. (2011) suspect that the Midcourse Space Experiment (MSX) infrared fluxes they measured were contaminated by other field stars, and then the infrared-to-radio flux ratios were overestimated. It would be useful to investigate if there is any difference between the infrared-to-radio flux ratios of these new PNs and that of other PNs closed to Galactic plane (GLIMPSE I, II, and 3D PNs). A comparison of the correlations between IRAC 8 μm versus NVSS 1.4 GHz and MIPS 24 μm versus NVSS 1.4 GHz integrated fluxes of the PNs is given in Fig. 7. The slopes of 1.03 for IRAC 8 μm to NVSS 1.4 GHz plot and 1.00 for MIPS 24 μm to NVSS 1.4 GHz plot in the logarithmic space are derived. From the left panel of Fig. 7, we find no obvious difference in the trend of these three PNs compared to that of the other PNs. Nevertheless, compared to the PNs in the 24 μm MIPS to 1.4 GHz NVSS plot, the infrared-to-radio flux ratios of these new discovered PNs are generally lower than that of the GLIMPSE II and GLIMPSE 3D PNs (Zhang & Kwok 2009; Zhang et al. 2012) (the right panel of Fig. 7). Unlike the 8 μm band, the 24 μm band does not suffer from the AIB contaminations and can better trace the dust emission. It may therefore be expected that these new PNs are more evolved than other PNs in the GLIMPSE II and GLIMPSE 3D fields.
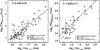 |
Fig. 7 Left panel: IRAC 8.0 μm vs. NVSS 1.4 GHz integrated fluxes for 83 PNs. Right panel: MIPS 24 μm vs. NVSS 1.4 GHz integrated fluxes for 48 PNs. The dotted line is a linear fit to the data. The fitting parameters are shown on the upper left corner of the figures. The open diamonds, filled triangles and circles are from the GLIMPSE 3D (Zhang et al. 2012), GLIMPSE II (Zhang & Kwok 2009), and GLIMPSE I (Kwok et al. 2008) survey, respectively. The asterisks denote our newly discovered PNs. |
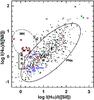 |
Fig. 8 Diagnostic diagram for the log (Hα/[N ii]) intensity ratio versus log (Hα/[S ii]) ratio showing the locations of SNRs, H ii regions (Riesgo & López 2006), HH objects (Cantó 1981), and the 90% probability ellipse of normal PNs. Also plotted are 551 Galactic PNs (black dots; Acker et al. 1992), HH object sample (brown asterisks; Raga et al. 1996), symbiotic stars (green squares; Luna & Costa 2005), IPHAS young PNs (purple diamonds; Viironen et al. 2009b) and five evolved PNs A35, NGC 650-1, NGC 6583, NGC 7293, and S 176 (red triangles; Sabbadin et al. 1977; Acker et al. 1992) with these new PNs of our sample (blue squares). |
4. The log (Hα/[N ii]) versus log (Hα/[S ii]) diagnostic diagram
The emission-line ratio diagrams are useful probes to the physical conditions of ionized gaseous nebulae. Sabbadin et al. (1977) first introduced the log(Hα/[N ii]) vs. log(Hα/[S ii]) (S2N2) diagnostic diagram to distinguish PNs from H ii regions and SNRs. The S2N2 diagnostic diagrams are also useful in differentiating excitation conditions. For example, SNRs are excited by the expanding shock waves, and their low Hα/[S ii] ratios are mainly dominated by the surrounding swept-up ISM. The H ii regions are photoionized, extended nebulae with low densities and their locations on the S2N2 diagnostic diagram are mainly influenced by their metallicities and excitation conditions (e.g. Viironen et al. 2007). The PNs are commonly nitrogen-rich as the result of CNO-processed ejecta from their progenitor stars. From this S2N2 diagnostic diagram, it is clear that the positions of PNs are systematically lower than the majority of SNRs, HH objects, and H ii regions, though there are some overlaps in these regions. The PNs also show a wide distribution in the Hα/[S ii] and Hα/[N ii] ratios depending on their evolutionary stages, metallicities, and different observed spatial positions of the nebulae. The ratios are essentially independent of extinction because of marginal difference in wavelengths.
To confirm the PN nature of our sample, we placed these objects into a revised version of the log(Hα/[N ii]) versus log(Hα/[S ii]) diagnostic diagram (Riesgo & López 2006) (Fig. 8). In the figure, we also plot examples of Herbig-Haro (HH) objects (Raga et al. 1996), symbiotic stars (Luna & Costa 2005), Galactic PNs (Acker et al. 1992), IPHAS young PNs (Viironen et al. 2009b) and five evolved PNs (Sabbadin et al. 1977; Acker et al. 1992) for comparison. All the PNs in our sample are located within the 90% probability ellipse area of PNs and are well separated from other objects. In addition, most new PNs share a similar position of bottom-left side in the diagram with other five evolved nebulae, indicating that they are probably low excitation PNs with high dynamic ages. Unlike the evolved PNs, the young PNs observed by Viironen et al. (2009b) are located in top-right side in the diagram.
5. Spectral energy distribution
Although PNs are best known by their emission-line spectra, a significant amount of the energy output is in the infrared, emitted by the dust component. The contribution of the dust component to the nebular emission can be inferred from the spectral energy distribution (SED). In Fig. 9, we construct the SED of one of the objects (PN3), which has extensive measurements from infrared archival data. In addition to the Spitzer and WISE photometric measurements, we also used observations from the IRAS and AKARI Point Source Catalogs (Ishihara et al. 2010; Helou & Walker 1988) in the infrared regions. Near-infrared magnitudes of J, H, and Ks observed by 2MASS are derived from 2MASS All Sky Catalog of Point Source database (Cutri et al. 2003). The IPHAS r′ band magnitude of this PN is obtained from Viironen et al. (2009a). A summary of the archival data and NVSS measurements is also given in Table 4. Since some of the filters used are broad, colour corrections may be needed for some flux density values given in Fig. 9 and Table 4. In the SED fitting, the colour corrections on the calibrated fluxes for WISE bands were performed using the colour correction factors given by Wright et al. (2010). The colour corrections are dependent on the dust temperature and the intrinsic SED and reflect the deviations of nebular spectra from that defined by the photometric system. The colour corrections are generally small except the wide WISE 12 μm band.
The SED of this PN without extinction correction is shown in Fig. 9. A rise in flux toward short wavelengths can be found in the SED. This could be due to the contribution from the photospheric and ionized gas components (see Zhang & Kwok 1991; Hsia et al. 2010). Due to the lack of ultraviolet observations and the extinction coefficient of this object, the central star and gaseous nebula contributions can not be accurately derived. We can see that the observed dust emission component is too broad to be fitted by a single dust temperature. Instead, we fit the dust component by two modified blackbodies with different temperatures, a warm (Twd) and a cold (Tcd) dust components. The thermal emission from the dust component is therefore given by  (1)where Fλ(d) is the flux density of dust thermal emission continuum, Mwd and Mcd are the masses of warm and cold dust components, ρs is the grain density, a is the radius of grain, which depends on its shape, Qλ = Q0 (λ/λ0)−α is the grain emissivity function, and D is the distance to the nebula (Kwok 2007, Eq. (10.23)). The temperatures of two dust components used in the fittings are 231 K and 60 K. From the SED, we can see that the IRAC 3.6/4.5 μm and WISE 3.4/4.6 μm bands are mainly dominated by the nebular continuum emission or photospheric contribution. It is also clear that the contributions of the WISE 12 μm and 22 μm bands are, respectively, from warm and cool dust components. The size of a graphite grain ranges from 0.005 μm < a < 0.25μm (Mathis et al. 1977). The density of small organic grains (ρs) is about 1 g cm-3 (Dopita & Sutherland 2000). The α value is adopted from 1 to 2 (Stasińska & Szczerba 1999). The value of Q (1 μm) ranges from 0.04 to 0.8 (which depends on the grain properties; see Figs. 4 and 5 of Draine & Lee (1984)). Assuming α = 1.5, ρs = 1 g cm-3, a = 0.1μm, Q (1 μm)= 0.1, and D = 5.56 kpc (see Sect. 6), we derive the masses of the warm and cold dust components to be 1.13 × 10⁻⁷M⊙ and 1.87 × 10⁻³M⊙, respectively. Comparison of the dust mass of a typical Galactic PN of ~10-4M⊙ (Pottasch et al. 1984), the dust mass of this nebula is significant larger than the usual values, suggesting that this PN is indeed very dusty and its optical counterpart is heavily obscured by circumstellar dust.
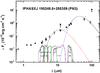 |
Fig. 9 SED of IPHASX J195248.8+255359 (PN3) without extinction correction in the wavelength range form 0.6 to 170 μm. The open triangle, filled triangles, open circles, filled diamonds, filled squares, and asterisks are from the r′-band photometry, 2MASS, Spitzer/GLIMPSE, WISE, IRAS, and AKARI survey, respectively. The light asterisks represent the unreliable AKARI detections. Note that the fluxes measured from IRAS 12 and 100 μm are upper limits. The dust component is fitted by two modified blackbodies (blue and red dashed lines) and total flux of dust component is plotted as a gray solid line. The normalized relative spectral response curves for Spitzer 3.6, 4.5, 5.8, 8.0 and 24 μm channels (green lines) and WISE 3.4, 4.6, 12 and 22 μm bands (purple lines) are also plotted on bottom. |
Properties of new PNs.
6. Distances and nebular age
The determination of the distances of Galactic PNs is a notoriously difficult problem. Accurate distances are needed to derive ionized, molecular, and dust masses of PNs, and the total number of expected Galactic PN population in the Galaxy. One method of distance determination, which uses extinction-independent parameters has been developed by Ortiz et al. (2011). Making use of the mid-infrared flux and angular sizes, distances to individual PN can be determined statistically based on a statistical sample correlation coefficients. This method is particularly appropriate for PNs on the Galactic plane which, suffer from substantial extinction.
The statistical distance as a function of infrared-radio correlation coefficients is given by Eq. (4) of Ortiz et al. (2011):  (2)where DMIR is the distance of the nebula, F8.3 is the infrared flux density measured from the MSX 8.3 μm band, θ8.3 is the correlated nebular radius obtained from the MSX 8.3 μm image, and a8.3, b8.3, and c8.3 are the coefficients listed in the Table 1 of Ortiz et al. (2011). According to the measurements of GLIMPSE PNs (Zhang & Kwok 2009), we have F8.3 = F8.0/0.9, where F8.0 is the IRAC 8.0 μm flux density. Assuming that the nebular radii observed in the MSX 8.3 μm band (θ8.3) are the same as that observed in the IRAC 8.0 μm channel (θ8.0), the formula can be re-written in the following form:
  (3)The derived distances are given in Table 6. According to Ortiz et al. (2011), the derived distances have error bars <50%.
The dynamical ages of these PNs can be estimated by their apparent sizes (from Hα+[N ii] images), distances, and expansion velocities. For some bipolar PNs, we adopt the averaged values of their major and minor lengths as their nebular sizes. In the special case of PN1, where its edge is not clear, we used the length between extended structures as the adopted size. The distances of the PNs are derived from the above calculations. An average expansion velocity (Vexp) of 22.5 km s-1 from [N ii] is adopted (Weinberger 1989). The nebular age of each object is then calculated from its physical radius divided by the expansion velocity. We estimated the errors of nebular ages based on the statistical errors of the distances (50%, Ortiz et al. 2011). Because the exact expansion velocity of each PN is unknown, the derived ages should be taken with some cautions. The nebular expansion velocity is mainly affected by the morphological class of a PN (Corradi & Schwarz 1995), the effective temperature of the central star (Teff), and the mass-loss rate of central source (Ṁ) (e.g., Pauldrach et al. 1988). Bipolar PNs are found to have larger nebular expansion velocities than other morphological types (elliptical, irregular, point-symmetric, and stellar PNs). Furthermore, the expansion velocity strongly increases with Teff and mildly decreases with Ṁ.
A summary of the properties of these new PNs is also presented in Table 6. We find that most of the PNs are relatively old with an averaged age of ~8900 ± 4500 years (compared to the median age of young PNs of 2470 years; Sahai et al. 2011), which is consistent with our previous results based on the S2N2 emission ratio diagnostic diagram. For bipolar PNs, the expansion velocities detected in the lobe parts are usually faster than in the central regions. Thus, it seems that the derived nebular ages of these PNs are likely to be upper limits.
7. Conclusions
Recent Hα surveys with high spatial resolutions and sensitivities have provided us a powerful tools to study PNs obscured in the Galactic plane. More than one thousand new PNs and PN candidates have been discovered in the MASH images and IPHAS photometric catalogues (Mampaso et al. 2006; Parker et al. 2006; Miszalski et al. 2008; Viironen et al. 2009b; Corradi & Sabin 2012), containing examples of young, compact PNs and old, extended, faint PNs. The nature of some of them is still unknown and requires spectroscopy. Here, we present an optical and infrared study of a sample of four new PN candidates discovered in the IPHAS and DSH catalogues. We have confirmed the PN status of these objects by the optical narrow-band images and mid-resolution spectra. From the locations of the new PNs in the S2N2 emission-line-ratio diagnostic diagram, we find that the nebulae are low excitation PNs with high dynamic ages.
Three new PNs in our sample (PN1, PN2, and PN3) are found to have obvious infrared counterparts. Some of them (PN2 and PN3) display prominent infrared emissions in the central regions, suggesting that most dust masses of these objects are located in the central parts. The infrared-to-radio flux ratios of these three PNs (PN1, PN2, and PN3) are generally lower than those of other PNs in the GLIMPSE II and GLIMPSE 3D fields, suggesting that they are more evolved. We constructed the SED of PN3 by collecting the photometries from a variety of astronomical data sets, which cover the wavelength range from visible to far-infrared. The observed infrared fluxes are successfully fitted by two dust components with temperatures of 231 K and 60 K, respectively. This PN might have a dusty envelope, which heavily obscures its optical counterpart. We estimated the distances and ages of these new PNs. They are relatively old with an averaged age of ~8900 ± 4500 years, which is consistent with the results obtained from the S2N2 diagnostic diagram and the infrared-to-radio ratios.
Acknowledgments
We are grateful to the anonymous referee. His/her comments helped us to improve this paper. Part of the data presented in this paper were obtained from the Wide-field Infrared Survey Explorer, which is a joint project of the University of California, Los Angeles, and the Jet Propulsion Laboratory/California Institute of Technology, funded by the National Aeronautics and Space Administration; and the Spitzer Space Telescope, which is operated by the Jet Propulsion Laboratory, California Institute of Technology under a contract with NASA. This work was partially supported by the Open Project Program of the Key Laboratory of Optical Astronomy, National Astronomical Observatories, Chinese Academy of Sciences. Financial supports for this work were provided by the Research Grants Council of the Hong Kong Special Administrative Region, China (project no. HKU 7062/13P and 7073/11P) and Small Project Funding of the Hong Kong University (project No. 201007176028).
References
- Acker, A., Marcout, J., Ochsenbein, F., et al. 1992, Strasbourg-ESO Catalogue of Galactic Planetary Nebulae, Parts I and II (Garching: European Southern Observatory) [Google Scholar]
- Anderson, L. D., Zavagno, A., Barlow, M. J., et al. 2012, A&A, 537, A1 [NASA ADS] [CrossRef] [EDP Sciences] [Google Scholar]
- Benjamin, R. A., Churchwell, E., Babler, B. L., et al. 2003, PASP, 115, 953 [NASA ADS] [CrossRef] [Google Scholar]
- Cantó, J. 1981, in Investigating the Universe, ed. F. D. Kahn (Dordrecht: Reidel), 95 [Google Scholar]
- Churchwell, E., Babler, B. L., Meade, M. R., et al. 2009, PASP, 121, 213 [NASA ADS] [CrossRef] [Google Scholar]
- Cohen, M., Green, A. J., Roberts, M. S. E., et al. 2005, ApJ, 627, 446 [NASA ADS] [CrossRef] [Google Scholar]
- Cohen, M., Parker, Q. A., Green, A. J., et al. 2007, ApJ, 669, 343 [NASA ADS] [CrossRef] [Google Scholar]
- Cohen, M., Parker, Q. A., Green, A. J., et al. 2011, MNRAS, 413, 514 [NASA ADS] [CrossRef] [Google Scholar]
- Condon, J. J., & Kaplan, D. L. 1998, ApJS, 117, 361 [NASA ADS] [CrossRef] [Google Scholar]
- Corradi, R. L. M., & Sabin, L. 2012, IAUS, 283, 17 [NASA ADS] [Google Scholar]
- Corradi, R. L. M., & Schwarz, H. E. 1995, A&A, 293, 871 [NASA ADS] [Google Scholar]
- Cutri, R. M., Skrutskie, M. F., van Dyk, S., et al. 2003, VizieR Online Data Catalog: II/246 [Google Scholar]
- Dopita, M. A., & Sutherland, R. S. 2000, ApJ, 539, 742 [NASA ADS] [CrossRef] [Google Scholar]
- Draine, B. T., & Lee, H. M. 1984, ApJ, 285, 89 [Google Scholar]
- Drew, J. E., Greimel, R., & Irwin, M. J., et al. 2005, MNRAS, 362, 753 [NASA ADS] [CrossRef] [Google Scholar]
- Fazio, G. G., Hora, J. L., Allen, L. E., et al. 2004, ApJS, 154, 10 [NASA ADS] [CrossRef] [Google Scholar]
- Filippenko, A. V. 1982, PASP, 94, 715 [NASA ADS] [CrossRef] [Google Scholar]
- Helou, G., & Walker, D. W. 1988, Infrared Astronomical Satellite (IRAS) Catalogs and Atlases, Vol. 7: The Small Scale Structure Catalog (NASA RP-1190, Washington: GPO) [Google Scholar]
- Hsia, C.-H., Kwok, S., Zhang, Y., et al. 2010, ApJ, 725, 173 [NASA ADS] [CrossRef] [Google Scholar]
- Howarth, I. D. 1983, MNRAS, 203, 301 [NASA ADS] [CrossRef] [Google Scholar]
- Hummer, D. G., & Storey, P. J. 1987, MNRAS, 224, 801 [NASA ADS] [CrossRef] [Google Scholar]
- Ishihara, D., Onaka, T., Kataza, H., et al. 2010, A&A, 514, A1 [NASA ADS] [CrossRef] [EDP Sciences] [Google Scholar]
- Jacoby, G. H., Kronberger, M., Patchick, D., et al. 2010, PASA, 27, 156 [NASA ADS] [CrossRef] [Google Scholar]
- Kohoutek, L. 2001, A&A, 378, 843 [NASA ADS] [CrossRef] [EDP Sciences] [Google Scholar]
- Kronberger, M., Teutsch, P., Alessi, B., et al. 2006, A&A, 447, 921 [NASA ADS] [CrossRef] [EDP Sciences] [Google Scholar]
- Kwok, S. 1989, in Planetary Nebulae, ed. S. Torres-Peimbert (Kluwer: Reidel), IAU Symp. 131, 401 [Google Scholar]
- Kwok, S. 2007, Physics and Chemistry of the Interstellar Medium (Sausalito, CA: Univ. Science Books) [Google Scholar]
- Kwok, S., Zhang, Y., Koning, N., et al. 2008, ApJS, 174, 426 [NASA ADS] [CrossRef] [Google Scholar]
- Luna, G. J. M., & Costa, R. D. D. 2005, A&A, 435, 1087 [NASA ADS] [CrossRef] [EDP Sciences] [Google Scholar]
- Mampaso, A., Corradi, R. L. M., & Viironen, K. 2006, A&A, 458, 203 [NASA ADS] [CrossRef] [EDP Sciences] [Google Scholar]
- Mathis, J. S., Rumpl, W., & Nordsieck, K. H. 1977, ApJ, 217, 425 [NASA ADS] [CrossRef] [Google Scholar]
- Miszalski, B., Parker, Q. A., Acker, A., et al. 2008, MNRAS, 384, 525 [NASA ADS] [CrossRef] [Google Scholar]
- Murakami, H., Baba, H., Barthel, P., et al. 2007, PASJ, 59, 369 [Google Scholar]
- Neugebauer, G., Habing, H. J., van Duinen, R., et al. 1984, ApJ, 278, L1 [Google Scholar]
- Ortiz, R., Copetti, M. V. F., & Lorenz-Martins, S. 2011, MNRAS, 418, 2004 [NASA ADS] [CrossRef] [Google Scholar]
- Parker, Q. A., Acker, A., Frew, D. J., et al. 2006, MNRAS, 373, 79 [NASA ADS] [CrossRef] [Google Scholar]
- Pauldrach, A., Puls, J., Kudritzki, R.-P., et al. 1988, A&A, 207, 123 [NASA ADS] [Google Scholar]
- Pottasch, S. R., Baud, B., Beintema, D., et al. 1984, A&A, 138, 10 [NASA ADS] [Google Scholar]
- Reach, W. T., Megeath, S. T., Cohen, M., et al. 2005, PASP, 117, 978 [NASA ADS] [CrossRef] [Google Scholar]
- Raga, A. C., Böhm, K.-H., & Cantó, J. 1996, Rev. Mex. Astron. Astrofis., 32, 161 [NASA ADS] [Google Scholar]
- Rieke, G. H., Young, E. T., Engelbracht, C. W., et al. 2004, ApJS, 154, 25 [NASA ADS] [CrossRef] [Google Scholar]
- Riesgo, H., & López, J. A. 2006, Rev. Mex. Astron. Astrofis., 42, 47 [NASA ADS] [Google Scholar]
- Sabbadin, F., Minello, S., & Bianchini, A. 1977, A&A, 60, 147 [NASA ADS] [Google Scholar]
- Sabin, L., Zijlstra, A. A., Wareing, C., et al. 2010, PASA, 27, 166 [NASA ADS] [CrossRef] [Google Scholar]
- Sabin, L., Corradi, R. L. M., & Mampaso, A. 2011, Rev. Mex. Astron. Astrofis, 40, 183 [Google Scholar]
- Sahai, R., Morris, M. R., & Villar, G. G. 2011, AJ, 141, 134 [NASA ADS] [CrossRef] [Google Scholar]
- Skrutskie, M. F., Cutri, R. M., Stiening, R., et al. 2006, AJ, 131, 1163 [NASA ADS] [CrossRef] [Google Scholar]
- Stasińska, G., & Szczerba, R. 1999, A&A, 352, 297 [NASA ADS] [Google Scholar]
- Storey, P. J., & Zeippen, C. J. 2000, MNRAS, 312, 813 [Google Scholar]
- Viironen, K., Delgado-Inglada, G., Mampaso, A., et al. 2007, MNRAS, 381, 1719 [NASA ADS] [CrossRef] [Google Scholar]
- Viironen, K., Greimel, R., Corradi, R. L. M., et al. 2009a, A&A, 504, 291 [NASA ADS] [CrossRef] [EDP Sciences] [Google Scholar]
- Viironen, K., Mampaso, A., Corradi, R. L. M., et al. 2009b, A&A, 502, 113 [NASA ADS] [CrossRef] [EDP Sciences] [Google Scholar]
- Wright, E. L., Eisenhardt, P. R. M., Mainzer, A. K., et al. 2010, AJ, 140, 1868 [NASA ADS] [CrossRef] [Google Scholar]
- Weinberger, R. 1989, A&AS, 78, 301 [NASA ADS] [Google Scholar]
- Zhang, C. Y., & Kwok, S. 1991, A&A, 250, 179 [NASA ADS] [Google Scholar]
- Zhang, Y., & Kwok, S. 2009, ApJ, 706, 252 [NASA ADS] [CrossRef] [Google Scholar]
- Zhang, Y., Hsia, C.-H., & Kwok, S. 2012, ApJ, 745, 59 [NASA ADS] [CrossRef] [Google Scholar]
All Tables
All Figures
|
Fig. 1 Images of DSH J1941.3+2430 (PN1) in [O iii] (left) and Hα+[N ii] (right) displayed on a linear intensity scale. North is up and east is to the left. The gray-scale bar is given at the bottom in units of counts per pixel. The position of this PN is marked with the red central cross. |
| In the text | |
|
Fig. 2 Images of IPHASX J194226.1+214522 (PN2) in [O iii] (left) and Hα+[N ii] (right) displayed on a linear intensity scale. North is up and east towards the left. The gray-scale bar is given at the bottom in units of counts per pixel. The position of PN2 is marked with the red central cross. |
| In the text | |
|
Fig. 3 [O iii] (left) and Hα+[N ii] (right) images of IPHASX J195248.8+255359 (PN3) displayed on a logarithmic intensity scale to show the outer lobes of the nebula. North is up and east is to the left. The gray-scale bar is given at the bottom in units of counts per pixel. The position of PN3 is marked with the red central cross. |
| In the text | |
|
Fig. 4 Images of IPHASX J232713.1+650923 (PN4) in [O iii] (left) and Hα+[N ii] (right) displayed on a linear intensity scale. North is up and east is to the left. The gray scale bar is given at the bottom in units of counts per pixel. The position of PN4 is marked with the red central cross. |
| In the text | |
|
Fig. 5 Optical spectra of the four sample PNs in the wavelength range of 4800 Å to 7400 Å. The prominent emission features are marked. |
| In the text | |
|
Fig. 6 Colour composite of the Spitzer IRAC images of PN1, PN2, and PN3. They are displayed on a logarithmic scale. These infrared images were made from three IRAC bands: 3.6 μm (shown as blue), 4.5 μm (green), and 8.0 μm (red). North is up and east is to the left. The central star of IPHASX J194226.1+214522 (PN2) can be seen in the IRAC image. |
| In the text | |
|
Fig. 7 Left panel: IRAC 8.0 μm vs. NVSS 1.4 GHz integrated fluxes for 83 PNs. Right panel: MIPS 24 μm vs. NVSS 1.4 GHz integrated fluxes for 48 PNs. The dotted line is a linear fit to the data. The fitting parameters are shown on the upper left corner of the figures. The open diamonds, filled triangles and circles are from the GLIMPSE 3D (Zhang et al. 2012), GLIMPSE II (Zhang & Kwok 2009), and GLIMPSE I (Kwok et al. 2008) survey, respectively. The asterisks denote our newly discovered PNs. |
| In the text | |
|
Fig. 8 Diagnostic diagram for the log (Hα/[N ii]) intensity ratio versus log (Hα/[S ii]) ratio showing the locations of SNRs, H ii regions (Riesgo & López 2006), HH objects (Cantó 1981), and the 90% probability ellipse of normal PNs. Also plotted are 551 Galactic PNs (black dots; Acker et al. 1992), HH object sample (brown asterisks; Raga et al. 1996), symbiotic stars (green squares; Luna & Costa 2005), IPHAS young PNs (purple diamonds; Viironen et al. 2009b) and five evolved PNs A35, NGC 650-1, NGC 6583, NGC 7293, and S 176 (red triangles; Sabbadin et al. 1977; Acker et al. 1992) with these new PNs of our sample (blue squares). |
| In the text | |
|
Fig. 9 SED of IPHASX J195248.8+255359 (PN3) without extinction correction in the wavelength range form 0.6 to 170 μm. The open triangle, filled triangles, open circles, filled diamonds, filled squares, and asterisks are from the r′-band photometry, 2MASS, Spitzer/GLIMPSE, WISE, IRAS, and AKARI survey, respectively. The light asterisks represent the unreliable AKARI detections. Note that the fluxes measured from IRAS 12 and 100 μm are upper limits. The dust component is fitted by two modified blackbodies (blue and red dashed lines) and total flux of dust component is plotted as a gray solid line. The normalized relative spectral response curves for Spitzer 3.6, 4.5, 5.8, 8.0 and 24 μm channels (green lines) and WISE 3.4, 4.6, 12 and 22 μm bands (purple lines) are also plotted on bottom. |
| In the text | |
Current usage metrics show cumulative count of Article Views (full-text article views including HTML views, PDF and ePub downloads, according to the available data) and Abstracts Views on Vision4Press platform.
Data correspond to usage on the plateform after 2015. The current usage metrics is available 48-96 hours after online publication and is updated daily on week days.
Initial download of the metrics may take a while.