Fig. 8
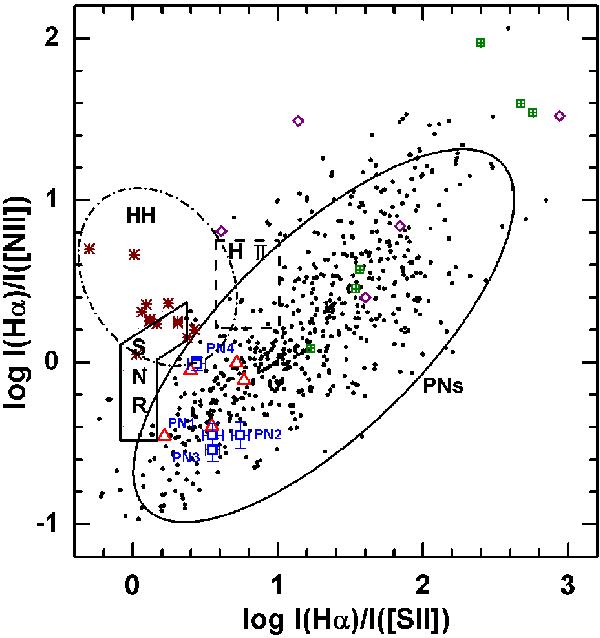
Diagnostic diagram for the log (Hα/[N ii]) intensity ratio versus log (Hα/[S ii]) ratio showing the locations of SNRs, H ii regions (Riesgo & López 2006), HH objects (Cantó 1981), and the 90% probability ellipse of normal PNs. Also plotted are 551 Galactic PNs (black dots; Acker et al. 1992), HH object sample (brown asterisks; Raga et al. 1996), symbiotic stars (green squares; Luna & Costa 2005), IPHAS young PNs (purple diamonds; Viironen et al. 2009b) and five evolved PNs A35, NGC 650-1, NGC 6583, NGC 7293, and S 176 (red triangles; Sabbadin et al. 1977; Acker et al. 1992) with these new PNs of our sample (blue squares).
Current usage metrics show cumulative count of Article Views (full-text article views including HTML views, PDF and ePub downloads, according to the available data) and Abstracts Views on Vision4Press platform.
Data correspond to usage on the plateform after 2015. The current usage metrics is available 48-96 hours after online publication and is updated daily on week days.
Initial download of the metrics may take a while.