Fig. 7
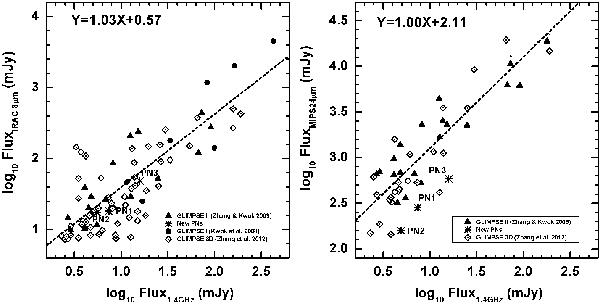
Left panel: IRAC 8.0 μm vs. NVSS 1.4 GHz integrated fluxes for 83 PNs. Right panel: MIPS 24 μm vs. NVSS 1.4 GHz integrated fluxes for 48 PNs. The dotted line is a linear fit to the data. The fitting parameters are shown on the upper left corner of the figures. The open diamonds, filled triangles and circles are from the GLIMPSE 3D (Zhang et al. 2012), GLIMPSE II (Zhang & Kwok 2009), and GLIMPSE I (Kwok et al. 2008) survey, respectively. The asterisks denote our newly discovered PNs.
Current usage metrics show cumulative count of Article Views (full-text article views including HTML views, PDF and ePub downloads, according to the available data) and Abstracts Views on Vision4Press platform.
Data correspond to usage on the plateform after 2015. The current usage metrics is available 48-96 hours after online publication and is updated daily on week days.
Initial download of the metrics may take a while.