Fig. 6
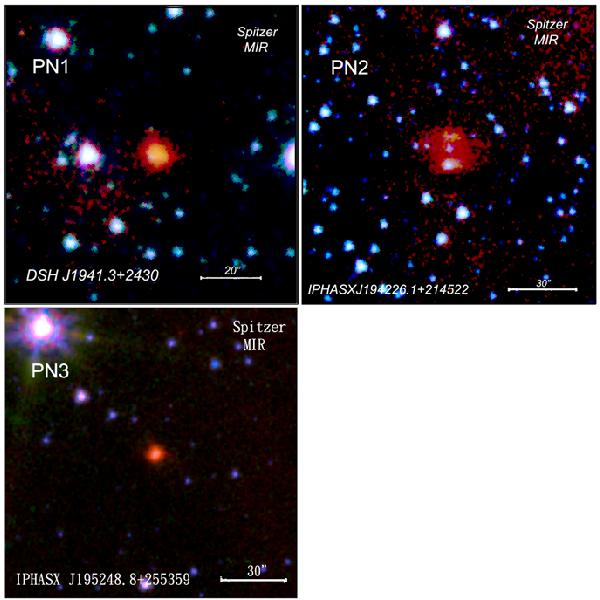
Colour composite of the Spitzer IRAC images of PN1, PN2, and PN3. They are displayed on a logarithmic scale. These infrared images were made from three IRAC bands: 3.6 μm (shown as blue), 4.5 μm (green), and 8.0 μm (red). North is up and east is to the left. The central star of IPHASX J194226.1+214522 (PN2) can be seen in the IRAC image.
Current usage metrics show cumulative count of Article Views (full-text article views including HTML views, PDF and ePub downloads, according to the available data) and Abstracts Views on Vision4Press platform.
Data correspond to usage on the plateform after 2015. The current usage metrics is available 48-96 hours after online publication and is updated daily on week days.
Initial download of the metrics may take a while.