Fig. 6
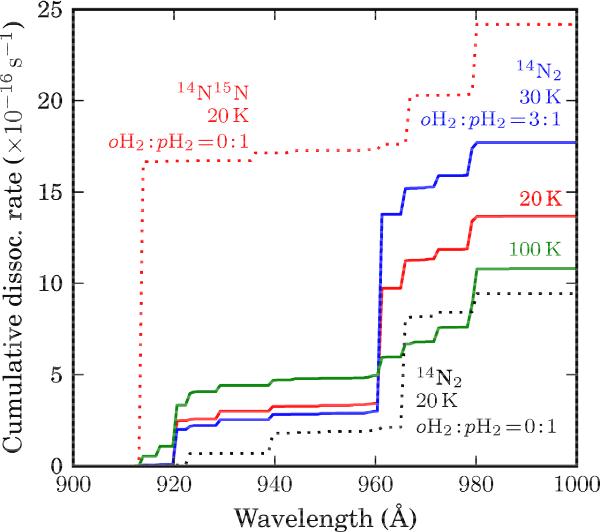
Dissociation rate of N2 due to cosmic-ray induced H2 emission under interstellar cloud conditions, integrated cumulatively with increasing wavelength. Rates for 14N2 are plotted with for several temperatures (solid curves), for and Tex = 20 K (black dotted curve), and a single case is included for 14N 15N (red dotted curve).
Current usage metrics show cumulative count of Article Views (full-text article views including HTML views, PDF and ePub downloads, according to the available data) and Abstracts Views on Vision4Press platform.
Data correspond to usage on the plateform after 2015. The current usage metrics is available 48-96 hours after online publication and is updated daily on week days.
Initial download of the metrics may take a while.