Fig. 5
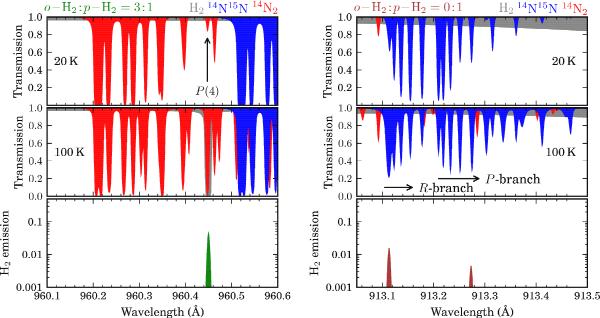
Modelled molecular absorption lines for two different excitation temperatures, 20
and 100 K, and cosmic-ray induced H2 emission. Otherwise calculated as
for Fig. 3. Left: overlap of
an o-H2 emission line with the
 P(4)
absorption line of 14N2. Right: overlap of
two p-H2 emission lines with absorption by the
P(4)
absorption line of 14N2. Right: overlap of
two p-H2 emission lines with absorption by the
 band of 14N
15N, with R and P branches indicated.
band of 14N
15N, with R and P branches indicated.
Current usage metrics show cumulative count of Article Views (full-text article views including HTML views, PDF and ePub downloads, according to the available data) and Abstracts Views on Vision4Press platform.
Data correspond to usage on the plateform after 2015. The current usage metrics is available 48-96 hours after online publication and is updated daily on week days.
Initial download of the metrics may take a while.