Fig. 4
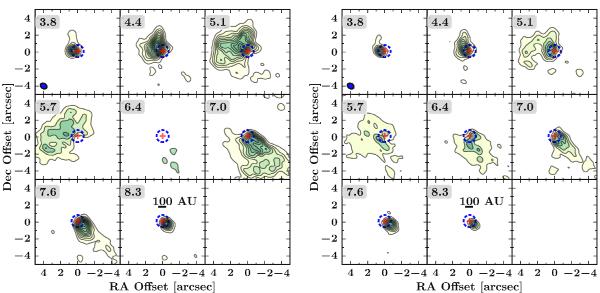
13CO (left) and C18O (right) 2–1 channel maps within the inner 10″ toward TMC1A. The velocities in km s-1 are indicated at the top left in each panel. The contours are drawn at every 3σ starting from 5σ where σ = 12 mJy km s-1 for 13CO and 10 mJy km s-1 for C18O.
Current usage metrics show cumulative count of Article Views (full-text article views including HTML views, PDF and ePub downloads, according to the available data) and Abstracts Views on Vision4Press platform.
Data correspond to usage on the plateform after 2015. The current usage metrics is available 48-96 hours after online publication and is updated daily on week days.
Initial download of the metrics may take a while.