Fig. C.3
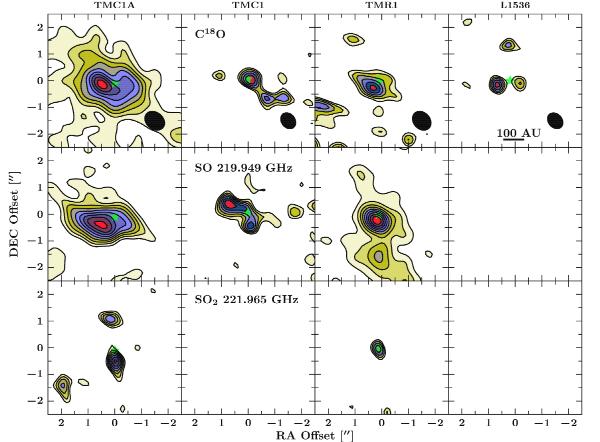
Moment 0 maps of C18O J = 2–1, SO 56–45 and SO2 11111−100010 toward all sources from the WideX data. The contours are drawn at 10% of the peak starting at 3σ. Green star indicates the continuum position and black ellipses show the synthesized beams.
Current usage metrics show cumulative count of Article Views (full-text article views including HTML views, PDF and ePub downloads, according to the available data) and Abstracts Views on Vision4Press platform.
Data correspond to usage on the plateform after 2015. The current usage metrics is available 48-96 hours after online publication and is updated daily on week days.
Initial download of the metrics may take a while.