Fig. 13
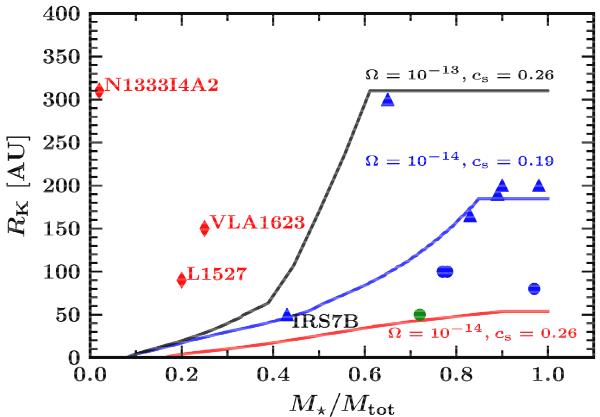
Comparison of the observed RSDs (symbols) and semi-analytical models (lines) from Harsono et al. (2013). The red diamonds indicate the Class 0 sources, blue circles show the Class I sources we have analyzed, and blue triangles show the Class I sources whose parameters were taken from the literatures. TMR1 is indicated by the green circle since the stellar mass is derived from the bolometric luminosity. Different lines show the evolution of RSDs with different initial conditions (cs = 0.26 km s-1 (black and red) and 0.19 km s-1 (blue); Ω = 10-13 Hz (black) and 10-14 Hz (red and blue)), keeping the initial core mass fixed at 1 M⊙.
Current usage metrics show cumulative count of Article Views (full-text article views including HTML views, PDF and ePub downloads, according to the available data) and Abstracts Views on Vision4Press platform.
Data correspond to usage on the plateform after 2015. The current usage metrics is available 48-96 hours after online publication and is updated daily on week days.
Initial download of the metrics may take a while.