Free Access
Fig. 11
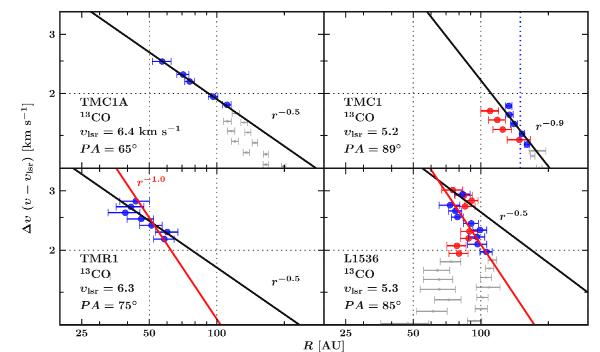
13CO uv-space PV diagrams toward all sources with the best fit profiles superposed in black lines (except for L1536). The red lines indicate a υ ∝ r-1 as comparison. Gray points show the peaks that were not included in the fitting.
Current usage metrics show cumulative count of Article Views (full-text article views including HTML views, PDF and ePub downloads, according to the available data) and Abstracts Views on Vision4Press platform.
Data correspond to usage on the plateform after 2015. The current usage metrics is available 48-96 hours after online publication and is updated daily on week days.
Initial download of the metrics may take a while.