Fig. 2
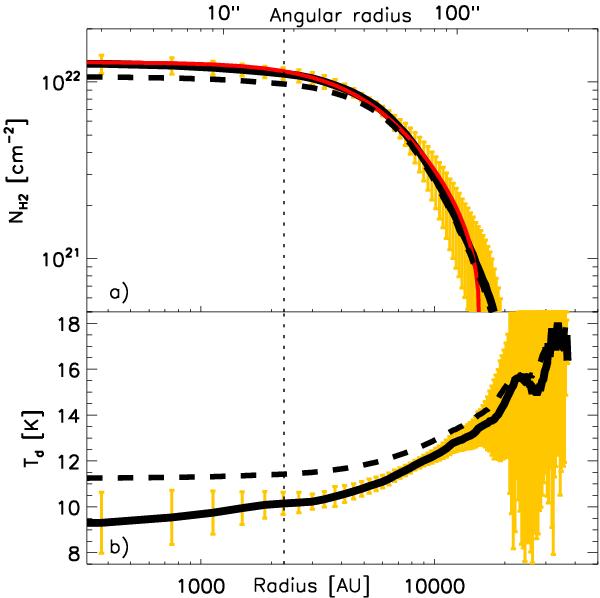
Column density a) and dust temperature b) profiles of B68
obtained at 500 μm resolution by applying the Abel inversion
method to the circularly averaged intensity profiles observed with Herschel
between 160 μm and 500 μm. a)
Comparison between the column density profiles derived from the Abel reconstruction
(solid black line) and LOS-averaged SED fitting (thick dashed line). The red curve
shows the best-fit Bonnor-Ebert model to the Abel-inverted profile (see Table 2 for parameters). The vertical dotted line
represents the half power beam radius of 36 3/2 (effective
500 μm
resolution). b) Comparison of the Abel-inverted (solid line) and
LOS-averaged SED (dashed curve) temperature profiles. The error bars represent the
standard deviation of NH2(r) and
Td(r) values obtained
from independent profile reconstructions along sixteen angular directions.
3/2 (effective
500 μm
resolution). b) Comparison of the Abel-inverted (solid line) and
LOS-averaged SED (dashed curve) temperature profiles. The error bars represent the
standard deviation of NH2(r) and
Td(r) values obtained
from independent profile reconstructions along sixteen angular directions.
Current usage metrics show cumulative count of Article Views (full-text article views including HTML views, PDF and ePub downloads, according to the available data) and Abstracts Views on Vision4Press platform.
Data correspond to usage on the plateform after 2015. The current usage metrics is available 48-96 hours after online publication and is updated daily on week days.
Initial download of the metrics may take a while.