| Issue |
A&A
Volume 561, January 2014
|
|
|---|---|---|
| Article Number | A92 | |
| Number of page(s) | 14 | |
| Section | Stellar atmospheres | |
| DOI | https://doi.org/10.1051/0004-6361/201322539 | |
| Published online | 09 January 2014 | |
Wind collisions in three massive stars of Cygnus OB2⋆,⋆⋆
Département AGO, Université de Liège, Allée du 6 Août 17, Bât. B5C, 4000 Liège, Belgium
e-mail: This email address is being protected from spambots. You need JavaScript enabled to view it.
Received: 26 August 2013
Accepted: 19 November 2013
Abstract
Aims. We wish to study the origin of the X-ray emission of three massive stars in the Cyg OB2 association: Cyg OB2 #5, Cyg OB2 #8A, and Cyg OB2 #12.
Methods. To this aim, dedicated X-ray observations from XMM-Newton and Swift are used, as well as archival ROSAT and Suzaku data.
Results. Our results on Cyg OB2 #8A improve the phase coverage of the orbit and confirm previous studies: the signature of a wind-wind collision is conspicuous. In addition, signatures of a wind-wind collision are also detected in Cyg OB2 #5, but the X-ray emission appears to be associated with the collision between the inner binary and the tertiary component orbiting it with a 6.7 yr period, without a putative collision inside the binary. The X-ray properties strongly constrain the orbital parameters, notably allowing us to discard some proposed orbital solutions. To improve the knowledge of the orbit, we revisit the light curves and radial velocity of the inner binary, looking for reflex motion induced by the third star. Finally, the X-ray emission of Cyg OB2 #12 is also analyzed. It shows a marked decrease in recent years, compatible with either a wind-wind collision in a wide binary or the aftermath of a recent eruption.
Key words: stars: early-type / stars: individual: Cyg OB2 #5 / stars: individual: Cyg OB2 #8A / stars: individual: Cyg OB2 #12 / X-rays: stars / binaries: eclipsing
Based on observations collected at the Observatoire de Haute Provence (OHP) as well as with Swift and XMM-Newton.
Tables 1–3 and 5 are available in electronic form at http://www.aanda.org
Research associate FNRS.
© ESO, 2014
1. Introduction
Massive stars lose large amounts of material during their lifetime, in the form of winds. In systems composed of several massive stars, these winds collide, giving rise to a wind-wind collision (WWC). These collisions might imprint their signature throughout the whole electromagnetic spectrum: nonthermal synchrotron emission (in the radio range, see van Loo et al. 2006; De Becker 2007, as well as in the gamma-ray range, see Leyder et al. 2010), periodic IR-dust emission (e.g., Tuthill et al. 1999), line profile changes in the optical (e.g., Rauw et al. 2001), hard thermal X-ray emission (e.g., Nazé et al. 2012b). To ascertain the origin of such emissions, very high angular resolution is necessary to resolve the WWC region from the stars (Dougherty et al. 2005; Pittard et al. 2002; Zhekov & Park 2010), or monitoring is required as the emission associated with WWCs usually varies with orbital phase. This paper focuses on the second approach.
One source of variation is the changing WWC orientation around the orbit. If the winds are of equal strengths, the WWC zone is planar and halfway between the two massive objects; if the winds are different, the WWC zone is a cone wrapped around the star with the weaker wind (Stevens et al. 1992). As the system rotates, the line-of-sight to this WWC region changes, modifying the observed radial velocity of the shocked wind, hence the associated line profiles (Sana et al. 2001; Henley et al. 2003). The rotation also induces changes in absorption, as the line-of-sight crosses the wind of each component in turn: if the wind densities differ sufficiently, a modulation of the absorption is then detected. The extreme case concerns very asymmetric binaries composed of an O-star and a Wolf-Rayet (Willis et al. 1995; Fauchez et al. 2011).
A second source of variations is linked to the changing distance between the components in eccentric systems. The behavior depends on the value of the cooling parameter, i.e., the ratio between the cooling time of the shocked gas and the escape time. It can be expressed as  , where v8 is the wind velocity in units of 1000 km s-1, d the distance to the contact discontinuity expressed in units of 107 km, and Ṁ-7 the mass loss rate in units of 10-7 M⊙ an-1 (Stevens et al. 1992). If χ ≪ 1, the gas cools very quickly and the collision is considered to be radiative. In this case, the X-ray emission should follow LX ∝ Ṁv2, where v is the pre-shock wind velocity, and the shocked plasma temperature might be lower at periastron if the winds are still accelerating when they collide. This situation regularly occurs in short-period O+O systems, but might also happen in long-period systems comprising slow or dense winds, as χ is, in fact, inversely related to the wind number density at the shock. An example of such radiative collisions can be found in HD 152248 (Sana et al. 2004). If χ ≥ 1, the gas does not easily cool and the collision is then adiabatic. In this case, the properties of the WWC zone mainly depend on the wind density: the X-ray emission is expected to vary as the inverse of the separation between the components. This case is relevant for most systems with orbital periods longer than a few days (Stevens et al. 1992) as in Cyg OB2 #9 (Nazé et al. 2012b) and WR25 (Gosset 2007). Note that radiative cooling might become significant, even in adiabatic collisions, in regions away from the line of centers, where the angle of collision is oblique, or at certain phases (such as the periastron).
Massive stars are intrinsic sources of X-rays, with a tight relation between the bolometric and high-energy luminosities (log [LX/LBOL ] ~ −7, e.g., Berghoefer et al. 1997). Two decades ago, some massive binaries were detected to be brighter in the X-ray domain, the additional emission being attributed to WWCs (Pollock 1987; Chlebowski & Garmany 1991). In recent years, however, the paradigm shifted, as many massive, O+OB binaries were not found to be overluminous (Pittard et al. 2000; Oskinova 2005; Nazé 2009; Nazé et al. 2011). The difference in luminosity between binaries and single objects is generally very small, at best (Nazé et al. 2013). Only few massive binaries appear strongly overluminous in the X-ray range, and even fewer have been monitored in detail (for a review, see Güdel & Nazé 2009), e.g., HD 93403 (Rauw et al. 2002), or WR22 (Gosset et al. 2009). These few cases are, however, the only ones to provide a testbed for theoretical WWC models and constrain the (still debated) stellar wind properties: finding new ones or clarifying the properties of known WWCs is, therefore, highly important.
The first massive stars detected in the X-ray range belonged to the Cyg OB2 association (Harnden et al. 1979). The four brightest sources were associated with Cyg OB2 #5, Cyg OB2 #8A, Cyg OB2 #9, and Cyg OB2 #12. Over the years, these objects have been sporadically observed at high energies, but a better sampling of the orbital cycle is needed. The first X-ray campaigns revealed changes in Cyg OB2 #8A (De Becker 2007; Blomme et al. 2010) and Cyg OB2 #9 (Nazé et al. 2012b). This paper provides further results from X-ray monitoring of Cyg OB2 #8A, Cyg OB2 #5, and Cyg OB2 #12. Section 2 presents the observations, Sects. 3–5 analyze the situation of each of these three massive stars in turn, and Sect. 6 summarizes our findings and concludes this paper.
2. Observations
For our study, we rely on the same XMM-Newton and Swift datasets as used for Cyg OB2 #9 in Nazé et al. (2012b), with the addition of one Swift/XRT exposure taken in March 2013. To ensure homogeneity and the use of the latest calibration, these X-ray data were processed again, using SAS v12.0.0. for XMM-Newton data and HEASOFT v6.13 for Swift data, following the recommendations of the respective instrument teams (European Space Agency Science Operations Centre (ESA SOC) and UK Swift center). We also used archival Suzaku and ROSAT data of Cyg OB2. Table 1 provides the identifier of these observations, as well as their date.
For XMM-Newton observations, a source detection algorithm (edetect_chain) was used to derive the position of our targets in each exposure. To ensure homogeneity, the shapes and relative positions of source and background regions remain the same for all seven XMM-Newton datasets. This is a complex task as the position angle and center of the field-of-view change for each exposure1. When possible, we then extract source events in circular regions of radii 50′′, 23′′, and 15′′2 (for MOS1, MOS2, and pn detectors, respectively) for Cyg OB2 #5, 14′′, 46′′, and 16′′ for the same three detectors for Cyg OB2 #12, and 26′′ for Cyg OB2 #8A (same region for all EPIC detectors). We selected circular (for MOS) and polygonal (for pn) background regions, as close as possible to the targets and devoid of other sources. We calculated individual response matrices for each target and each observation (tasks rmfgen, arfgen). We performed pile-up checks, showing no impact for our targets. The last four XMM-Newton observations were affected by episodes of soft proton flares, which we discarded. Note, however, that the results of spectra fitting remain the same whether we keep or cut the time intervals affected by flares. For Swift observations, we extracted source events in circular regions centered on the Simbad coordinates of the targets and with radii 21′′ for Cyg OB2 #5 and Cyg OB2 #12, and 11′′ for Cyg OB2 #8A. A polygonal background region, common to all targets, was used: it is located within the trapezium formed by the targets and Cyg OB2 #9 and it is as large as possible, to ensure good statistics on the background and to avoid any localized background variation. For the Swift observations, we used the response matrix file provided by the Swift team (swxpc0to12s6_20010101v013.rmf), but calculated an individual ancillary response file (ARF) specifically for the targets using the task xrtmkarf, with the inclusion of an exposure map so that we take bad columns into account. For ROSAT observations, we extracted source events in circular regions centered on the Simbad coordinates of the targets and with radii 61′′, 27′′, and 42′′ for Cyg OB2 #5, Cyg OB2 #8A, and Cyg OB2 #12, respectively; we used as backgrounds a nearby circular region of radius 39′′ for Cyg OB2 #8A and annular regions of outer radii of 97′′ and 84′′ (the inner radii being equal to the radii of the source regions) for Cyg OB2 #5 and Cyg OB2 #12, respectively. The archival redistribution matrix files (RMFs) for the position sensitive proportional counter B (PSPCB; pspcb_gain1_256.rmf and pspcb_gain2_256.rmf for the first and second observations, respectively) were used, and we calculated individual ARFs for each target and each exposure (task pcarf). For the Suzaku observation, source events were extracted in circular regions centered on the Simbad coordinates of the targets with radii 100′′ and 90′′ for Cyg OB2 #5 and Cyg OB2 #12, respectively, while we used nearby circular regions with 100′′ radii for background. Response matrices were calculated for the source using online calibration files, as recommended for Suzaku spectra. Data from both 3 × 3 and 5 × 5 modes and from all available X-ray Imaging Spectrometer (XIS) chips (0, 1, and 3) were then combined.
Some observations were grouped or split, depending on the period of the system under scrutiny. For Cyg OB2 #5, the first five Swift observations, taken a few months apart, were grouped when considering the long 6.7 yr period, as they present similar phases in this case (see Sect. 4), and the second ROSAT observation (ObsID 900314) was split into four exposures when considering the short 6.6 d period as that observation covers a large part of the 6.6 d orbit (see Table 1). For Cyg OB2 #8A, we grouped the second, third, and fourth Swift observations as they correspond to similar phases in the 21.9 d period of the system. For Cyg OB2 #12, we grouped the first five Swift observations since the main variations occur on long timescales.
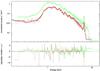 |
Fig. 1 Cyg OB2 #8A spectra acquired with the MOS1 (black), MOS2 (red), and pn (green) detectors in November 2004 (Rev. 0906) along with the best-fit model and its residuals. |
Finally, we fitted all extracted spectra within Xspec v12.8.0 (using apec v2.0.1). A combination of models for optically thin thermal plasma absorbed by interstellar and wind material3 was used: two to three thermal emission components were necessary to obtain a good fit (see below). Fits to the XMM-Newton data were first performed allowing all the parameters to vary, and when a parameter was seen to remain constant, it was fixed; for the Swift, ROSAT and Suzaku spectra, it was often necessary to fix as many parameters as possible, to avoid erratic variations (see below for details).
3. The object Cyg OB2 #8A
The object Cyg OB2 #8A is an O6If + O5.5III(f) binary with a period of 21.9 d (De Becker et al. 2004). It is also a nonthermal radio emitter, indicating that a WWC occurs in the system. Phase-locked modulation of the radio emission was reported by Blomme et al. (2010). The same authors also derived improved orbital and physical parameters for the stars. The bright X-ray emission also displays phase-locked variability (De Becker et al. 2006), but the radio and X-ray emissions show anticorrelated behaviors (Blomme et al. 2010), as the formation regions are different (closer to the apex of the shock cone for X-rays).
We used Swift data along with an additional XMM-Newton observation to increase phase coverage. We used an interstellar absorbing column of 0.91 × 1022 cm-2 (corresponding to E(B − V) = 1.56 of Wegner 2003 when using the Bohlin et al. 1978 conversion ratio) and the ephemeris of De Becker et al. (2004). The associated phases of the observations are listed in Table 1. First, we performed spectral fitting of the sole XMM-Newton data (Fig. 1). Three thermal components were necessary to achieve a good fit, and it should be noted that the temperatures at apastron (φ = 0.5) are slightly higher than at periastron, which is consistent with the results of Blomme et al. (2010). This can be explained by the larger wind speeds at apastron, as the winds have more time to accelerate before they collide. However, this increase is within the error bars, hence is not formally significant (as in Blomme et al. 2010) so that the derived temperatures can be considered constant within the uncertainties. We, therefore, fixed these temperatures and fitted all XMM-Newton spectra again. The normalization factor of the first thermal component appears slightly lower at phase φ = 0.5 (i.e., apastron), but this is again not significant considering the uncertainties. This implies that most of this component is born in the winds of the stars, not at the WWC zone. We thus fitted all spectra again with temperatures and first normalization fixed to the average value from XMM-Newton fits (Table 2). We note that this does not change the results significantly compared to fully-free fitting.
Looking at the results, several conclusions can be drawn. The additional absorption is maximum at periastron and minimum at apastron (Fig. 2), in agreement with the findings of De Becker et al. (2006). This is linked to the system’s orientation: the primary star, whose wind is strongest, is in front of the secondary star near periastron, resulting in a larger additional absorption; on the contrary, the secondary star is in front of the primary star near apastron, resulting in a smaller absorption.
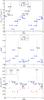 |
Fig. 2 Evolution with phase of the hard X-ray flux (top), the absorption (middle) and the normalization factors (bottom) for Cyg OB2 #8A. In the bottom panel, filled and empty symbols represent XMM-Newton and Swift data, respectively. Note that for the middle and bottom panels, all Swift data but those of 00031904005 were grouped to increase signal-to-noise ratio, the length of the bin representing the phase interval covered by the data. |
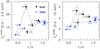 |
Fig. 3 Evolution with relative separation (r/a with a the semi-major axis) of the soft and hard X-ray fluxes for Cyg OB2 #8A. |
The normalization factors of the second and third thermal components vary in antiphase (Fig. 2): the second normalization appears minimum at apastron, while the third one is maximum at that phase. This difference in behavior might appear puzzling, but is, in fact, normal in view of the formation zones of the thermal components. The hardest X-rays come from the head-on collision between the winds, which occurs at the apex of the shock cone, near the line joining the centers of the two stars. The variation of the normalization factor associated with the hard component is thus linked to the peculiarities of the WWC: in radiative systems such as Cyg OB2 #8A, the collision occurs at higher speeds at apastron, when the winds have enough space to accelerate to higher speeds. The shock is thus stronger at apastron, explaining the increase in hard emission. The softest X-rays come from regions further down the shock cone, which are less sensitive to velocity differences, as the shock already occurs there at reduced speeds. The changes in the normalization factors associated with these lower temperatures (though slight for the first normalization) are rather dominated by variations in plasma density: the density, hence the emission, is higher when stars are close to each other.
Combining the three components, the global flux indeed also varies (Fig. 2). The particularity is that its peak does not occur at apastron or periastron, but at an intermediate phase of φ ~ 0.8 (this confirms the preliminary results of De Becker et al. 2006). This probably stems from the behavior of the normalization factors: at that phase, the second normalization is already high, while the third normalization is not yet minimum (Fig. 2). Hydrodynamic simulations of the WWC in Cyg OB2 #8A aimed at reproducing the X-ray spectra at a few phases could reproduce the lower flux at periastron (φ = 0), but could not find a clear peak at that intermediate phase. Rather, a flux close to, but still lower than, the apastron flux (φ = 0.5) was found (De Becker et al. 2006). However, more sophisticated models by Pittard & Parkin (2010) yield somewhat different results. They reveal that the X-ray emission could be asymmetric around periastron (or apastron) in eccentric systems, as the emission properties at a given phase depend on the properties of the plasma created at earlier phases. Though the systems modeled by Pittard & Parkin (2010) are different from Cyg OB2 #8A (the only eccentric model has a shorter period and involves two identical main sequence objects, therefore, the shocked winds have different radiative timescales than here), a comparison with our observation reveals interesting similarities. In particular, an asymmetry is observed in the variation of the normalization factors and in the fluxes of Cyg OB2 #8A. Once the fluxes are plotted as a function of separation (Fig. 3), as in Fig. 19 of Pittard & Parkin (2010), the predicted hysteresis behavior is clearly seen: the emission is harder as the stars get closer than when the stars separate. However, the models predict the largest hysteresis near periastron, where the properties of the shocked plasma rapidly change, but this is not observed: the largest variation occurs in between apastron and periastron. Definitely, a full hydro model, sampling the whole orbit, is now needed.
4. The object Cyg OB2 #5
The object Cyg OB2 #5 has long been known to be an eclipsing binary, but it was recently found to be a quadruple system (Kennedy et al. 2010). The core of Cyg OB2 #5 is a short-period (6.6 d), eclipsing binary composed of an O6.5–7I and an OB–Ofpe/WN9 transition object. Linder et al. (2009) showed that the stars are in a contact configuration, and that the secondary hemisphere facing the primary is hotter and brighter. Phases derived from Linder et al. (2009) are given in Table 1 for each observation. The system is a nonthermal radio emitter, which is an indication of the presence of a WWC. Strangely, the radio emission of the binary is not modulated with the 6.6 d period, but with a period of about 6.7 yr. Kennedy et al. (2010), therefore, deduced that a third star exists in the system, orbiting the binary in a 6.7 yr orbit. This third component can be associated with a late O/early B-type star (Kennedy et al. 2010). These authors proposed several possible orbital solutions for the tertiary orbit that could explain the radio emission. The ephemeris of their favored model (s = 0) is used for the phases shown in Table 1, associated with the long period. Further away, at 0.9′′ to the NE, a visual companion with early B-type is located: it is the fourth component of the complex Cyg OB2 #5 system (Contreras et al. 1997). The orbital period of this fourth component around the triple system has been estimated at 9200 yr for a distance of 1.7 kpc (Linder et al. 2009). Kennedy et al. (2010) have detected a second WWC zone near this star, a nonthermal emission with the typical “crescent moon” shape associated with WWC shock cones.
The X-ray emission of Cyg OB2 #5 is somewhat brighter than usual for massive stars (log [LX/LBOL ] ~ −6.4), but it was not known to vary much (Linder et al. 2009). In particular, no clear 6.6 d modulation was seen in the first six XMM-Newton observations (Linder et al. 2009), so that the origin of the X-ray emission remains unclear, especially in view of the new results on the system’s composition.
Our dataset includes much more data than were available to Linder et al. (2009), enabling us to revisit the properties of Cyg OB2 #5. We used an interstellar absorbing column of 1.14 × 1022 cm-2 (corresponding to E(B − V) = 1.96, Wegner 2003), the quadratic ephemerides for the binary of Linder et al. (2009), and the preliminary ephemeris for the third star of the favorite model of Kennedy et al. (2010). The associated phases of the observations are given in Table 1. As for Cyg OB2 #8A, we first performed spectral fitting of the XMM-Newton data only (Fig. 4). As frequently happens when fitting X-ray spectra of massive stars, two sets of temperatures provide equally good fits: 0.2+1.2 keV and 0.7+1.9 keV. As the results of the fluxes and variations of the parameters are similar4, in the following we will only discuss the first solution. The derived temperatures can be considered constant within the uncertainties, so that we fixed them and fitted all XMM-Newton spectra again (Table 3). The ratio between the two normalization factors remains similar, within the uncertainties, amongst the observations, so that we further fixed it to 14.9 for fitting the Swift, Suzaku and ROSAT spectra (Table 3).
The new dataset covers the 6.6 d orbit several times, but yields surprising results. Indeed, when plotted against the phase in the 6.6 d period, the flux appears scattered (Fig. 5): the XMM-Newton data of Rev. 1355 appears much brighter than the Swift data taken at a similar phase, and the XMM-Newton data of Rev. 1353 appear much brighter than those of Rev. 2114 and some ROSAT observations (ObsIDs 200109 and first part of 900314), despite a similar phase. The modulation of the X-ray properties is thus not associated with the binary period. We, therefore, tested the data against the 6.7 yr period. This time, the variations appear much better phased: all XMM-Newton data from 2004 lie close together, with the XMM-Newton observation taken seven years later, in 2011; the two XMM-Newton datasets from 2007 appear brighter, but at another phase (Fig. 5).
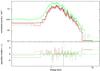 |
Fig. 4 Cyg OB2 #5 spectra acquired with the MOS1 (black), MOS2 (red) and pn (green) detectors in November 2004 (Rev. 0911) along with the best-fit model and its residuals. |
One might wonder whether these 2007 data are not corrupted in some way, as they are the only data in which the source is very bright. This scenario can be rejected for several reasons: (1) the two datasets were not taken on the same satellite orbit, rendering a technical problem unlikely; (2) the two datasets do not yield a peculiar brightening for Cyg OB2 #8A or Cyg OB2 #12 (this paper), or the other sources of the field (Rauw 2011; Nazé et al. 2012b); (3) the Suzaku observation taken in 2007 confirm the brightening at that time of Cyg OB2 #5 (Table 3, confirming Yoshida et al. 2011). Therefore, we analyzed the results further by considering that the X-ray emission could be modulated with the 6.7 yr period. In addition to an increased flux, we found a stronger absorption at φ < 0.2 (Fig. 5). For a WWC, the flux and absorption variations are linked to the orbit of the stars: our findings can thus be related to orbital parameters.
Finally, one might wonder why the two XMM-Newton data from 2007 yield such different results. Several scenarios are possible: either these short-term changes are due to inhomogeneities crossing the shock (as in η Car, Moffat & Corcoran 2009), or these variations suggest that part of the X-ray emission is linked to another WWC, in the binary or between the three stars and the fourth one.
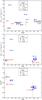 |
Fig. 5 Evolution of the soft X-ray flux with phase considering two periods of Cyg OB2 #5: the short period of the binary (6.6 d, top) and the long period of the triple system (6.7 yr, middle). The bottom panel shows the evolution with phase of the absorption, for the latter period only. |
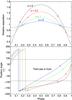 |
Fig. 6 Evolution with phase of the relative distance between the contact binary system and the third star (top) and of their relative position (bottom) for the four orbital solutions proposed for Cyg OB2 #5 by Kennedy et al. (2010). The position angle is zero when the third star is in front of the binary, and 180° when the binary is in front of the third star. The circles indicate the position of the 2007 XMM-Newton observation (left side) and of the 2011 XMM-Newton observations (right side). |
4.1. Toward an orbital solution for the third star in Cyg OB2 #5?
While the orbit of the eclipsing binary is now well known (Linder et al. 2009), the orbit of the third star around the binary system is not well constrained. Kennedy et al. (2010) proposed four solutions, which could explain the observed changes in radio emission, but the uncertainties on their parameters are high: an error of 4% is associated with the period, while the error on the inclination is about 40°, and eccentricity ranges from ~0.1 to ~0.7, time of periastron varies by 320 days, and the argument of periastron ranges from 23 to 352°, depending on the chosen orbital solution. The derived X-ray properties can help further constrain the orbital parameters.
Absorption variations are expected when the WWC zone and its associated X-ray emission are seen through different winds. The orbital solutions from Kennedy et al. (2010) are able to explain the larger absorption at φ < 0.2: at these phases, the contact binary system is in front (see lower panel of Fig. 6), i.e., on the part of its orbit located toward the observer, so that the WWC zone is seen through its denser wind. For a long-period system, we also expect an increase in flux as the separation between the components decreases (Stevens et al. 1992). The exact amount of change directly depends on the eccentricity of the system. The four solutions of Kennedy et al. (2010) have very different eccentricities, so that they predict very different variations in flux.
The two solutions with low eccentricities (s = 1 or 2 in Kennedy et al. 2010) imply limited changes in separation (see upper panel of Fig. 6), incompatible with the large observed variation in flux. The intermediate solution (s = 0.5 in Kennedy et al. 2010) would lead to a change in flux opposite to what is seen in the data (i.e., the source being much brighter in 2004 and 2011 than in 2007), so that this solution can be discarded too.
The solution favored by Kennedy et al. (2010), that with s = 0, is thus also our favorite. However, its ephemeris is certainly not perfect. Indeed, we would expect the largest flux for the second ROSAT dataset (ObsID 900314), since it was taken close to the expected periastron passage in the 6.7 yr period (Fig. 5). Such a flux is not observed, but ROSAT is not sensitive to hard X-rays, so that we requested a new Swift observation, which confirmed the ROSAT results. These new data show only a moderate increase in hard flux (about 35%) relative to observations at φ ~ 0.8, while a change by a factor of 2.6 is expected. Moreover, the variation between the XMM-Newton data taken in 2007 (Revs. 1353 and 1355) and the observations at φ ~ 0.8 amounts to 85%, whereas the solution by Kennedy et al. (2010) suggests 20%. Therefore, if a high eccentricity is favored for the orbit of the third star, a revised ephemeris is certainly needed.
To complement the X-ray monitoring, we have made the first steps in this direction by considering the reflex motion of the binary due to the presence of the third star. For example, the eclipses provide a clock that can be used to find temporal delays produced by light travel time effects linked to orbital motion. To this aim, we searched for times of primary minima in the literature (Table 4). Choosing one of these dates as (arbitrary) reference, we calculated the time difference between the other observations and the reference (Fig. 7). We find that the delay increases as the binary recedes, as expected (Fig. 7). Linder et al. (2009) adopted an alternative working hypothesis, where a change of the orbital period due to mass loss leads to quadratic ephemerides. To determine these quadratic ephemerides, Linder et al. (2009) used the times of primary eclipse quoted by Hall (1974), as well as their own data and the result of Hübscher & Walter (2007). However, the fit with the quadratic ephemerides inconsistent with the three data points of Sazonov (1961) and the measurement of Hübscher & Walter (2007) that led to large residuals. With our new interpretation, the data of Sazonov (1961) and Hübscher & Walter (2007) follow the trend expected for a time delay in a triple system. However, a large deviation is now found for the point of Miczaika (1953). This is surprising as the observations of the latter author were taken roughly at the same time as the third epoch quoted by Sazonov (1961). Unfortunately, the phase coverage of the light curve of Miczaika (1953) is quite limited and the time of primary minimum is simply quoted as the time of minimum light in the data collected by this author. Generally speaking, the uncertainties on the determination of the times of primary minimum from most of the archival data are difficult to estimate. Therefore, a new, precise monitoring of the system is required to further improve the orbital solution.
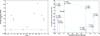 |
Fig. 7 Left: evolution with phase of the difference in time between expected and observed eclipses (primary minima) of Cyg OB2 #5. Right: orbit of the binary (in the favored solution of Kennedy et al. 2010) along with these temporal differences. The observer is toward the bottom. |
Time delays between dates of primary minima of the inner binary system of Cyg OB2 #5 found in the literature and a reference date.
Kennedy et al. (2010) had already compared the observed radial velocities of the binary components in Cyg OB2 #5 with the predicted radial velocities of a mean orbital solution. They showed that their favorite solution is compatible with the observed residuals, but the large error bars (7−9 km s-1 to be compared with their maximum velocity difference of 22.5 km s-1) and incomplete phase coverage (periastron passage not covered) could not lead to a significant statistical test. Following the s = 0 solution of Kennedy et al. (2010), a more significant variation could be expected around periastron (see their Fig. 11) and the first semester of 2013 is close to the expected periastron passage in their favorite solution.
We have thus obtained optical spectra over six consecutive nights in June 2013. Our observing campaign corresponds to orbital phase 0.07 of the 6.7 yr cycle (according to the s = 0 ephemeris of Kennedy et al. 2010). The spectra were taken with the Aurélie spectrograph (Gillet et al. 1994) at the 1.52 m telescope of the OHP. We used a 600 lines mm-1 grating blazed at 5000 Å and covered the wavelength domain from 4448 to 4886 Å at a resolving power of ≃10 000. The detector was an EEV 42-20 CCD with 2048 × 1024 pixels. The data reduction was done in the standard way (see Rauw et al. 2003), using the MIDAS software provided by ESO.
Assessing the velocities of the binary components is not easy, however: different lines in the spectra of components A and B often yield different systemic velocities and some of the secondary’s absorption lines (H i, He i) display P-Cygni profiles over some parts of the orbital cycle (Rauw et al. 1999). A reliable indicator of a change in systemic velocity could, however, be the velocity of the peak of the He ii λ 4686 emission line. Indeed, this line undergoes strong profile variations over the 6.6 d cycle, but the radial velocities of its peak were found to describe a very stable sine-wave variation following the primary’s motion (see Figs. 3 and 4 of Rauw et al. 1999). Figure 8 illustrates the radial velocities that we measured on the June 2013 data, along with the best-fit S-wave curve from Rauw et al. (1999), i.e., not a new fit5! In fact, the shift between the new and old data amounts to (0.5 ± 24.7) km s-1, indicating that there is no net shift in the systemic velocity of the June 2013 data with respect to the older data of Rauw et al. (1999), despite their different phases in the 6.7 yr cycle. If the s = 0 solution of Kennedy et al. (2010) was correct, one would rather expect a systemic velocity shifted by about 35 km s-1 toward the negative values. As the X-ray data suggested, the s = 0 solution favored by Kennedy et al. (2010) is far from perfect, underlining the need to collect spectroscopic data over the full 6.7 yr radio cycle, to establish the orbital solution of the third component.
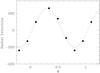 |
Fig. 8 Radial velocities of the He ii λ 4686 emission line as measured on our June 2013 optical spectra of Cyg OB2 #5. The S-wave relation from Rauw et al. (1999) is shown by the dashed line. No systematic shift is found between the data and the curve, while the s = 0 orbital solution of Kennedy et al. (2010) predicts a shift of about 35 km s-1 toward negative values. |
4.2. Revised light curve of Cyg OB2 #5
In principle, the analysis of the light curve of an eclipsing binary yields the absolute dimensions of its components. These numbers can then be used to infer the distance of the binary system. This approach was adopted by Linder et al. (2009) to derive a distance of d = (925 ± 0.25) pc (DM = 9.83 ± 0.06) for Cyg OB2 #5. This number is significantly lower than the distance estimates of Cyg OB2 found in the literature (DM = 11.2 ± 0.1, Massey & Thompson 1991, Kiminki et al. 2007; DM = 10.4, Hanson 2003; d = (1.40 ± 0.08) kpc, Rygl et al. 2012). Recently, Dzib et al. (2013) determined a distance of  kpc for Cyg OB #5. This distance estimate was obtained from the trigonometric parallax of the most compact radio source in the system.
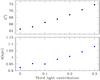 |
Fig. 9 Top: the best-fit orbital inclination as a function of the third light contribution. Typical uncertainties on i are 1.5°. Bottom: distance of Cyg OB2 #5 inferred from the light curve analysis as a function of the third light contribution. |
However, the analysis of Linder et al. (2009) could be biased by the presence of a third light. Indeed, Cyg OB2 #5 was subsequently found to most likely consist of four stars (Kennedy et al. 2010). The astrometric companion (star D in Kennedy et al. 2010) is too faint to play a role in the combined light (Contreras et al. 1997). The properties of the third component (star C) are poorly constrained, although it seems likely that this could be a luminous late O-type star (Kennedy et al. 2010).
The depths of the primary and secondary eclipses (about 0.35 and 0.25 mag, respectively) leave significant room for a third light contribution. Indeed, assuming that both eclipses would be total eclipses, we find an upper limit on the third light of 52% of the total light. Yet, if star C were that bright, it should dominate the spectrum of Cyg OB2 #5. Although we cannot rule out the presence of a third system of lines, the observed spectra of Cyg OB2 #5 are dominated by features that exhibit the signature of the 6.6 d orbital cycle (Rauw et al. 1999). Therefore, the contribution of star C is very likely below about 30%. To the zeroth order, the distance is expected to vary as  where lA, lB and lC are the fluxes of components A, B (the primary and secondary of the eclipsing binary), and C, respectively, in the waveband under consideration. However, the presence of a third light in the light curve also affects the best-fit parameters inferred for components A and B, and a full analysis is thus required to evaluate the impact of the third light on the distance estimate.
We have thus repeated the analysis of the light curve presented by Linder et al. (2009) accounting this time for the contribution of a nonzero third light. The analysis was performed with the NIGHTFALL code (version 1.70) developed and maintained by Wichmann, Kuster, and Risse6. The assumptions were the same as in the work of Linder et al. (2009): both stars of the eclipsing binary are in a contact or overcontact configuration with identical Roche-lobe filling factors, the primary star has an effective temperature of 36 000 K, the secondary star features an extended hot spot on the side facing the primary (latitude and longitude fixed at 0° and − 15°, respectively). We varied the third light contribution lC/(lA + lB + lC) between 0 and 30% by steps of 5%. For each assumed third light contribution, we obtained the best fit to the observed continuum band light curves.
As one could expect, the best-fit orbital inclination increases monotonically with increasing contribution of the third light (see Fig. 9). The best-fit Roche-lobe filling factor also increases slightly from 1.00 to 1.03 when the third light contribution varies from 0 to 30%. The best-fit parameters of the binary components thus change (this is especially the case for the secondary star), but their overall properties remain in qualitative agreement with the description of Linder et al. (2009). The lower panel of Fig. 9 indicates the dependence of the distance with the third light contribution. This figure shows that even for a 30% contribution, the distance “only” increases to 1.1 kpc. We thus conclude that third light alone cannot bring the distance of the eclipsing binary into agreement with other distance estimates.
If Cyg OB2 #5 is indeed a member of Cyg OB2, which seems rather likely, other factors must play a role. For instance, an obvious factor could be a higher primary star temperature. Indeed, the temperature estimate could be biased by contamination of the spectrum by component C. Assessing an unbiased temperature estimate requires disentangling the spectra of components A, B, and C. This is currently not possible though, as we are lacking sufficient coverage of the 6.7 yr cycle. Another factor could be uncertainties on the reddening. Here, we have adopted AV = 6.37 (see discussion in Linder et al. 2009), which corresponds to RV = 3.27. Reducing RV to 3.1 would increase the distance modulus by 0.33 mag, and thus the distance, by 16%.
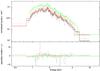 |
Fig. 10 Cyg OB2 #12 acquired with the MOS1 (black), MOS2 (red), and pn (green) detectors in May 2007 (Rev. 1355) along with the best-fit model and its residuals. |
5. The object Cyg OB2 #12
The star Cyg OB2 #12 is one of the brightest stars in the Galaxy (e.g., Massey & Thompson 1991). Though it is a very luminous hot star, its classification as a Luminous Blue Variable (LBV) remains debated. Indeed, it lacks some of the typical LBV characteristics (Clark et al. 2012). Its bright (log [LX/LBOL ] = −6.1, Rauw 2011) X-ray emission is also unusual for such objects, considering its wind properties and its isolated nature (Nazé et al. 2012a).
Rauw (2011) analyzed the first six XMM-Newton observations, finding high temperatures and some variability. These properties are reminiscent of WWCs or of magnetically confined winds, though no sign of binarity or magnetic field was detected up to now for Cyg OB2 #12.
Our dataset improves the temporal coverage of X-ray studies, leading to a revision of the known properties of Cyg OB2 #12. We used an equivalent H absorbing column of 1.97 × 1022 cm-2 (corresponding to E(B − V) = 3.40, van Genderen 2001) and first performed spectral fitting of the XMM-Newton data only, using two thermal components. The best-fit values of the additional absorption are zero or compatible with zero within the uncertainties. Furthermore, the best-fit temperatures are high: 0.86 and 2.11 keV. They appear slightly lower in the last XMM-Newton dataset, but the difference does not appear significant if we take the error bars into account. Therefore, we fixed the temperatures, discarded the additional absorption, and fitted all XMM-Newton spectra (Table 5, Fig. 10) again. The ratio between the two normalization factors remains similar, within the uncertainties, amongst the observations, so that we further fixed it to norm1/norm2 ~ 3.26 for fitting the Swift, ROSAT, and Suzaku spectra (Table 5).
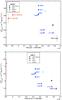 |
Fig. 11 Evolution with time of the soft and total X-ray fluxes of Cyg OB2 #12. |
While the short-term variations reported by Rauw (2011) are confirmed, a long-term trend with larger amplitude is now detected (Fig. 11). The observed X-ray flux decreases by 40% between 2004 and 2011 in the XMM-Newton data, and this decrease is confirmed by Swift and Suzaku data. Such a decrease can occur when the shocks linked to an eruption (an expected phenomenon for LBVs) settle down. However, no eruption was reported in the literature for Cyg OB2 #12 in previous years, although the star does not appear to have been monitored so an eruption might have been missed. Another possibility to explain this decrease exists: a variation in the flux of a WWC as the two stars of an eccentric binary system recede from each other after periastron passage. In this case, Cyg OB2 #12 would be a long-period binary, and its changes should be recurrent. Older ROSAT (Table 5) and the Advanced Satellite for Cosmology and Astrophysics (ASCA) (Yoshida et al. 2011) observations taken in the 1990s indicate a brightening of Cyg OB2 #12, consistent with a WWC observed before periastron passage. The binary period would then not be shorter than 24 yr. However, other evidence for binarity is lacking in available data. The object Cyg OB2 #12, therefore, appears as a complex system, requiring additional monitoring, notably to search for binarity signatures.
6. Conclusions
Using a dedicated X-ray monitoring, we have analyzed the behavior of three massive stars in the Cyg OB2 association: Cyg OB2 #5, Cyg OB2 #8A, and Cyg OB2 #12.
First, we have enlarged the orbital coverage of Cyg OB2 #8A, and confirmed the previous results reported for the star: a slight temperature increase at apastron, an additional absorption maximum at periastron and minimum at apastron, and a flux maximum at an intermediate phase (φ ~ 0.8). We have further analyzed the variability of the individual normalization factors, showing that they agree with expectations for WWCs. With data covering ~8.2 yr (more than 100 cycles), the phase-locked variations of the system are now clearly ascertained, and the predicted hysteresis behavior of the fluxes is detected for the first time in a colliding wind binary. While observations are sufficient in number for covering the whole orbit, a dedicated full hydro model would be required to improve our understanding of the collision.
Second, we have reanalyzed the X-ray emission of Cyg OB2 #5 using more data, showing that a modulation with the short period of the binary is unlikely. The most probable explanation is a modulation linked to the 6.7 yr period of the tertiary, which explains the flux and absorption variations well. However, for in-depth testing, a precise ephemeris of the third star is needed, which is not (yet) available. Light travel time delaying the eclipses and radial velocity variations might help ascertain the orbit, and we have performed the first steps in this direction.
Third, our data shed a new light on the X-ray emission of Cyg OB2 #12, a peculiar B-hypergiant. The overall flux has been decreasing over the last decade, which could be associated with changes in a wind-wind collision occurring in a (very) long-period binary or with the aftermath of an eruption. Further monitoring is now required to pinpoint the nature of this peculiar object.
Online material
Journal of observations (date of mid-exposure, duration, identifier, and phases for the known periods, see text for details).
Results of the X-ray spectral fitting for Cyg OB2 #8A.
Results of the X-ray spectral fitting for Cyg OB2 #5.
Results of the X-ray spectral fitting for Cyg OB2 #12.
For Cyg OB2 #8A, a unique background region for all pn observations could not be defined. We used two regions, one for the first four XMM-Newton observations, and one for the three remaining observations.
We note however that a circular region radius of 8′′ for the first pn observation (ObsID 0200450201) had to be considered.
Although this contribution comes from ionized material, a neutral absorption component was used to represent it. The difference in absorptions by neutral and ionized materials occurs below 1 keV, where there is no usable data due to the high interstellar absorption in Cyg OB2.
The main differences between the two models are (1) the additional absorptions (~0.6 and ~0.3 × 1022 cm-2 for the lower temperature pair and the larger temperature pair, respectively) and (2) the ratios between the two normalization factors (~14.9 and ~4.0 for the lower temperature pair and the larger temperature pair, respectively).
Note that the scatter around the S-wave curve is comparable to that found in the old data.
Acknowledgments
We thank the Swift PI, Dr Neil Gehrels, and the XMM-Newton project scientist, Norbert Schartel, for having made the X-ray monitoring possible. We also thank the referee for his suggestions that helped improve the paper. YN acknowledges useful discussion with Kim Page on Swift data reduction and calibration. The Liège team acknowledges support from the Fonds National de la Recherche Scientifique (Belgium), the Communauté Française de Belgique, the PRODEX XMM and Integral contracts, and the “Action de Recherche Concertée” (CFWB-Académie Wallonie Europe). ADS and CDS were used for preparing this document.
References
- Berghoefer, T. W., Schmitt, J. H. M. M., Danner, R., & Cassinelli, J. P. 1997, A&A, 322, 167 [NASA ADS] [Google Scholar]
- Blomme, R., De Becker, M., Volpi, D., & Rauw, G. 2010, A&A, 519, A111 [NASA ADS] [CrossRef] [EDP Sciences] [Google Scholar]
- Bohlin, R. C., Savage, B. D., & Drake, J. F. 1978, ApJ, 224, 132 [NASA ADS] [CrossRef] [Google Scholar]
- Contreras, M. E., Rodriguez, L. F., Tapia, M., et al. 1997, ApJ, 488, L153 [NASA ADS] [CrossRef] [Google Scholar]
- De Becker, M. 2007, A&ARv, 14, 171 [NASA ADS] [CrossRef] [Google Scholar]
- De Becker, M., Rauw, G., & Manfroid, J. 2004, A&A, 424, L39 [NASA ADS] [CrossRef] [EDP Sciences] [Google Scholar]
- De Becker, M., Rauw, G., Sana, H., et al. 2006, MNRAS, 371, 1280 [NASA ADS] [CrossRef] [Google Scholar]
- Chlebowski, T., & Garmany, C. D. 1991, ApJ, 368, 241 [NASA ADS] [CrossRef] [Google Scholar]
- Clark, J. S., Najarro, F., Negueruela, I., et al. 2012, A&A, 541, A145 [NASA ADS] [CrossRef] [EDP Sciences] [Google Scholar]
- Dougherty, S. M., Beasley, A. J., Claussen, M. J., Zauderer, B. A., & Bolingbroke, N. J. 2005, ApJ, 623, 447 [NASA ADS] [CrossRef] [Google Scholar]
- Dzib, S. A., Rodríguez, L. F., Loinard, L., et al. 2013, ApJ, 763, 139 [NASA ADS] [CrossRef] [Google Scholar]
- Fauchez, T., De Becker, M., & Nazé, Y. 2011, Bull. Soc. Roy. Sci. Liège, 80, 673 [NASA ADS] [Google Scholar]
- Gillet, D., Burnage, R., Kohler, D., et al. 1994, A&AS, 108, 181 [NASA ADS] [Google Scholar]
- Gosset, E. 2007, Habilitation thesis, University of Liège, Belgium [Google Scholar]
- Gosset, E., Nazé, Y., Sana, H., Rauw, G., & Vreux, J.-M. 2009, A&A, 508, 805 [NASA ADS] [CrossRef] [EDP Sciences] [Google Scholar]
- Güdel, M., & Nazé, Y. 2009, A&AR, 17, 309 [CrossRef] [Google Scholar]
- Hall, D. S. 1974, Acta Astron., 24, 69 [NASA ADS] [Google Scholar]
- Hanson, M. M. 2003, ApJ, 597, 957 [NASA ADS] [CrossRef] [Google Scholar]
- Harnden, F. R., Jr., Branduardi, G., Gorenstein, P., et al. 1979, ApJ, 234, L51 [NASA ADS] [CrossRef] [Google Scholar]
- Henley, D. B., Stevens, I. R., & Pittard, J. M. 2003, MNRAS, 346, 773 [NASA ADS] [CrossRef] [Google Scholar]
- Hübscher, J., & Walter, F. 2007, IBVS, 5761, 1 [NASA ADS] [Google Scholar]
- Kennedy, M., Dougherty, S. M., Fink, A., & Williams, P. M. 2010, ApJ, 709, 632 [NASA ADS] [CrossRef] [Google Scholar]
- Kiminki, D. C., Kobulnicky, H. A., Kinemuchi, K., et al. 2007, ApJ, 664, 1102 [NASA ADS] [CrossRef] [Google Scholar]
- Leyder, J.-C., Walter, R., & Rauw, G. 2010, A&A, 524, A59 [NASA ADS] [CrossRef] [EDP Sciences] [Google Scholar]
- Linder, N., Rauw, G., Manfroid, J., et al. 2009, A&A, 495, 231 [NASA ADS] [CrossRef] [EDP Sciences] [Google Scholar]
- Massey, P., & Thompson, A. B. 1991, AJ, 101, 1408 [NASA ADS] [CrossRef] [Google Scholar]
- Miczaika, G. R. 1953, PASP, 65, 141 [NASA ADS] [CrossRef] [Google Scholar]
- Moffat, A. F. J., & Corcoran, M. F. 2009, ApJ, 707, 693 [NASA ADS] [CrossRef] [Google Scholar]
- Nazé, Y. 2009, A&A, 506, 1055 [NASA ADS] [CrossRef] [EDP Sciences] [Google Scholar]
- Nazé, Y., Broos, P. S., Oskinova, L., et al. 2011, ApJS, 194, 7 [NASA ADS] [CrossRef] [Google Scholar]
- Nazé, Y., Rauw, G., & Hutsemékers, D. 2012a, A&A, 538, A47 [NASA ADS] [CrossRef] [EDP Sciences] [Google Scholar]
- Nazé, Y., Mahy, L., Damerdji, Y., et al. 2012b, A&A, 546, A37 [NASA ADS] [CrossRef] [EDP Sciences] [Google Scholar]
- Nazé, Y., Rauw, G., Sana, H., & Corcoran, M. F. 2013, A&A, 555, A83 [NASA ADS] [CrossRef] [EDP Sciences] [Google Scholar]
- Oskinova, L. M. 2005, MNRAS, 361, 679 [NASA ADS] [CrossRef] [Google Scholar]
- Pittard, J. M., & Parkin, E. R. 2010, MNRAS, 403, 1657 [NASA ADS] [CrossRef] [Google Scholar]
- Pittard, J. M., Stevens, I. R., Corcoran, M. F., et al. 2000, MNRAS, 319, 137 [NASA ADS] [CrossRef] [Google Scholar]
- Pittard, J. M., Stevens, I. R., Williams, P. M., et al. 2002, A&A, 388, 335 [NASA ADS] [CrossRef] [EDP Sciences] [Google Scholar]
- Pollock, A. M. T. 1987, ApJ, 320, 283 [NASA ADS] [CrossRef] [Google Scholar]
- Rauw, G. 2011, A&A, 536, A31 [NASA ADS] [CrossRef] [EDP Sciences] [Google Scholar]
- Rauw, G., Vreux, J.-M., & Bohannan, B. 1999, ApJ, 517, 416 [NASA ADS] [CrossRef] [Google Scholar]
- Rauw, G., Nazé, Y., Carrier, F., et al. 2001, A&A, 368, 212 [NASA ADS] [CrossRef] [EDP Sciences] [Google Scholar]
- Rauw, G., Vreux, J.-M., Stevens, I. R., et al. 2002, A&A, 388, 552 [NASA ADS] [CrossRef] [EDP Sciences] [Google Scholar]
- Rauw, G., De Becker, M., & Vreux, J.-M. 2003, A&A, 399, 287 [NASA ADS] [CrossRef] [EDP Sciences] [Google Scholar]
- Rygl, K. L. J., Brunthaler, A., Sanna, A., et al. 2012, A&A, 539, A79 [NASA ADS] [CrossRef] [EDP Sciences] [Google Scholar]
- Sana, H., Rauw, G., & Gosset, E. 2001, A&A, 370, 121 [NASA ADS] [CrossRef] [EDP Sciences] [Google Scholar]
- Sana, H., Stevens, I. R., Gosset, E., Rauw, G., & Vreux, J.-M. 2004, MNRAS, 350, 809 [NASA ADS] [CrossRef] [Google Scholar]
- Sazonov, V. 1961, Peremennye Zvezdy, 13, 445 [NASA ADS] [Google Scholar]
- Stevens, I. R., Blondin, J. M., & Pollock, A. M. T. 1992, ApJ, 386, 265 [NASA ADS] [CrossRef] [Google Scholar]
- Tuthill, P. G., Monnier, J. D., & Danchi, W. C. 1999, Nature, 398, 487 [NASA ADS] [CrossRef] [Google Scholar]
- van Genderen, A. M. 2001, A&A, 366, 508 [NASA ADS] [CrossRef] [EDP Sciences] [Google Scholar]
- van Loo, S., Runacres, M. C., & Blomme, R. 2006, A&A, 452, 1011 [NASA ADS] [CrossRef] [EDP Sciences] [Google Scholar]
- Wegner, W. 2003, Astron. Nachr., 324, 219 [NASA ADS] [CrossRef] [Google Scholar]
- Willis, A. J., Schild, H., & Stevens, I. R. 1995, A&A, 298, 549 [NASA ADS] [Google Scholar]
- Wilson, O. C., & Abt, A. 1951, ApJ, 114, 477 [NASA ADS] [CrossRef] [Google Scholar]
- Yoshida, M., Kitamoto, S., & Murakami, H. 2011, PASJ, 63, S717 [NASA ADS] [Google Scholar]
- Zhekov, S. A., & Park, S. 2010, ApJ, 709, L119 [NASA ADS] [CrossRef] [Google Scholar]
All Tables
Time delays between dates of primary minima of the inner binary system of Cyg OB2 #5 found in the literature and a reference date.
Journal of observations (date of mid-exposure, duration, identifier, and phases for the known periods, see text for details).
All Figures
|
Fig. 1 Cyg OB2 #8A spectra acquired with the MOS1 (black), MOS2 (red), and pn (green) detectors in November 2004 (Rev. 0906) along with the best-fit model and its residuals. |
| In the text | |
|
Fig. 2 Evolution with phase of the hard X-ray flux (top), the absorption (middle) and the normalization factors (bottom) for Cyg OB2 #8A. In the bottom panel, filled and empty symbols represent XMM-Newton and Swift data, respectively. Note that for the middle and bottom panels, all Swift data but those of 00031904005 were grouped to increase signal-to-noise ratio, the length of the bin representing the phase interval covered by the data. |
| In the text | |
|
Fig. 3 Evolution with relative separation (r/a with a the semi-major axis) of the soft and hard X-ray fluxes for Cyg OB2 #8A. |
| In the text | |
|
Fig. 4 Cyg OB2 #5 spectra acquired with the MOS1 (black), MOS2 (red) and pn (green) detectors in November 2004 (Rev. 0911) along with the best-fit model and its residuals. |
| In the text | |
|
Fig. 5 Evolution of the soft X-ray flux with phase considering two periods of Cyg OB2 #5: the short period of the binary (6.6 d, top) and the long period of the triple system (6.7 yr, middle). The bottom panel shows the evolution with phase of the absorption, for the latter period only. |
| In the text | |
|
Fig. 6 Evolution with phase of the relative distance between the contact binary system and the third star (top) and of their relative position (bottom) for the four orbital solutions proposed for Cyg OB2 #5 by Kennedy et al. (2010). The position angle is zero when the third star is in front of the binary, and 180° when the binary is in front of the third star. The circles indicate the position of the 2007 XMM-Newton observation (left side) and of the 2011 XMM-Newton observations (right side). |
| In the text | |
|
Fig. 7 Left: evolution with phase of the difference in time between expected and observed eclipses (primary minima) of Cyg OB2 #5. Right: orbit of the binary (in the favored solution of Kennedy et al. 2010) along with these temporal differences. The observer is toward the bottom. |
| In the text | |
|
Fig. 8 Radial velocities of the He ii λ 4686 emission line as measured on our June 2013 optical spectra of Cyg OB2 #5. The S-wave relation from Rauw et al. (1999) is shown by the dashed line. No systematic shift is found between the data and the curve, while the s = 0 orbital solution of Kennedy et al. (2010) predicts a shift of about 35 km s-1 toward negative values. |
| In the text | |
|
Fig. 9 Top: the best-fit orbital inclination as a function of the third light contribution. Typical uncertainties on i are 1.5°. Bottom: distance of Cyg OB2 #5 inferred from the light curve analysis as a function of the third light contribution. |
| In the text | |
|
Fig. 10 Cyg OB2 #12 acquired with the MOS1 (black), MOS2 (red), and pn (green) detectors in May 2007 (Rev. 1355) along with the best-fit model and its residuals. |
| In the text | |
|
Fig. 11 Evolution with time of the soft and total X-ray fluxes of Cyg OB2 #12. |
| In the text | |
Current usage metrics show cumulative count of Article Views (full-text article views including HTML views, PDF and ePub downloads, according to the available data) and Abstracts Views on Vision4Press platform.
Data correspond to usage on the plateform after 2015. The current usage metrics is available 48-96 hours after online publication and is updated daily on week days.
Initial download of the metrics may take a while.