Fig. 2
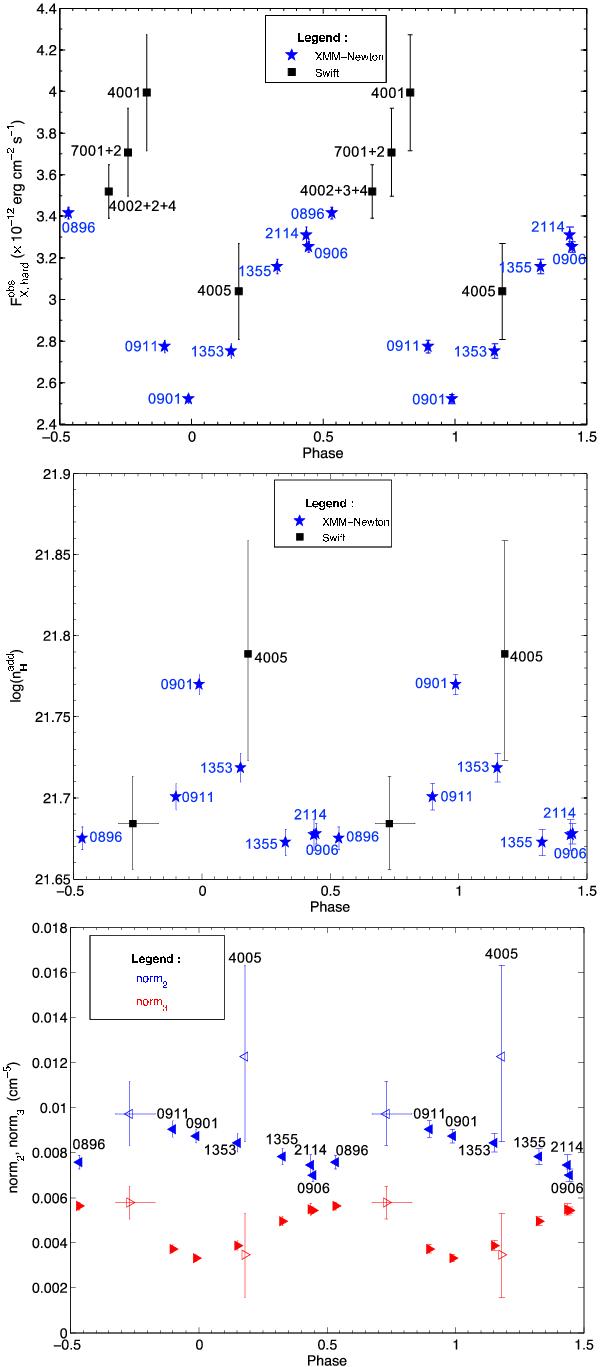
Evolution with phase of the hard X-ray flux (top), the absorption (middle) and the normalization factors (bottom) for Cyg OB2 #8A. In the bottom panel, filled and empty symbols represent XMM-Newton and Swift data, respectively. Note that for the middle and bottom panels, all Swift data but those of 00031904005 were grouped to increase signal-to-noise ratio, the length of the bin representing the phase interval covered by the data.
Current usage metrics show cumulative count of Article Views (full-text article views including HTML views, PDF and ePub downloads, according to the available data) and Abstracts Views on Vision4Press platform.
Data correspond to usage on the plateform after 2015. The current usage metrics is available 48-96 hours after online publication and is updated daily on week days.
Initial download of the metrics may take a while.