| Issue |
A&A
Volume 561, January 2014
|
|
|---|---|---|
| Article Number | A65 | |
| Number of page(s) | 6 | |
| Section | Planets and planetary systems | |
| DOI | https://doi.org/10.1051/0004-6361/201321783 | |
| Published online | 03 January 2014 | |
Extrasolar planets and brown dwarfs around A-F type stars⋆,⋆⋆
VIII. A giant planet orbiting the young star HD 113337
1 Institut de Planétologie et d’Astrophysique de Grenoble, UMR 5274 CNRS, Université Joseph Fourier, BP 53, 38041 Grenoble Cedex 9, France
e-mail: Simon.Borgniet@obs.ujf-grenoble.fr
2 Centro de Astrofisica, Universidade do Porto, Rua das Estrelas, 4150-762 Porto, Portugal
3 Aix Marseille Université, CNRS, LAM (Laboratoire d’Astrophysique de Marseille) UMR 7326, 13388 Marseille, France
4 Aix Marseille Université, CNRS, OHP (Observatoire de Haute-Provence), Institut Pythéas, UMS 3470, 04870 Saint-Michel l’ Observatoire, France
5 Institut d’Astrophysique de Paris, UMR 7095 CNRS, Université Pierre & Marie Curie, 98bis boulevard Arago, 75014 Paris, France
6 Observatoire de Haute-Provence, CNRS/OAMP, 04870 St-Michel l’ Observatoire, France
7 Observatoire de Genève, Université de Genève, 51 Chemin des Maillettes, 1290 Sauverny, Switzerland
8 Departamento de Fisica e Astronomia, Faculdade de Ciências, Universidade do Porto, Rua do Campo Alegre, 4169-007 Porto, Portugal
Received: 26 April 2013
Accepted: 23 September 2013
Aims. In the context of the search for extrasolar planets and brown dwarfs around early-type main-sequence stars we present the detection of a giant planet around the young F-type star HD 113337. We estimated the age of the system to be 150 Myr. Interestingly, an infrared excess attributed to a cold debris disk was previously detected around this star.
Methods. We used the SOPHIE spectrograph on the 1.93 m telescope at Observatoire de Haute-Provence to obtain ~300 spectra over six years. We used our tool dedicated to the spectra analysis of A and F stars to derive the radial velocity variations.
Results. The data reveal a period of  days that we attribute to a giant planet with a minimum mass of 2.83 ± 0.24 MJup in an eccentric orbit with e = 0.46 ± 0.04. A long-term quadratic drift, which we assign to be probably of stellar origin, is superimposed on the Keplerian solution.
Key words: techniques: radial velocities / stars: early-type / planetary systems / stars: individual: HD 113337
Based on observations made with the SOPHIE spectrograph at the Observatoire de Haute-Provence (CNRS, France).
Table 2 is only available at the CDS via anonymous ftp to cdsarc.u-strasbg.fr (130.79.128.5) or via http://cdsarc.u-strasbg.fr/viz-bin/qcat?J/A+A/561/A65
© ESO, 2014
1. Introduction
Thanks to hundreds of planet discoveries1 (Schneider et al. 2011) mainly by radial velocity (RV) or transit surveys since Mayor & Queloz (1995), our knowledge of exoplanets has dramatically improved. From these surveys, we now know that exoplanets are frequently observed around solar-type stars. More than 50% of these stars have planets with a wide range of masses and, among them, about 14% have planets with masses larger than 50 MEarth (Mayor et al. 2011). These surveys have revealed an unexpected diversity of planet properties in separations, eccentricities, and orbital motions (e.g., retrograde orbits). These discoveries highlight the importance of dynamics, either through planet-planet or planet-disk interactions, in the building of the architecture of planetary systems. Meanwhile, many open questions remain regarding several aspects of planet formation, even in the case of giant planets. Transit explorations and RV, after mainly characterizing Jupiter-like planets, are now detecting Neptune-like planets (10−40 MEarth) and Super Earths (1.2−10 MEarth). However, these techniques are still mostly limited to planets within a separation of typically 5 au from their parent stars. Moreover, they target generally solar-type main-sequence stars or evolved stars. Imaging techniques are sensitive only to giant planets orbiting at large separations, from 8 to 1000 au, around young stars, typically ≃1−100 Myr. These limitations have several consequences. In particular, it is difficult to test the impact of the host star mass on the planets’ properties, while formation models predict different behaviors according to the stellar mass (roughly, for the core-accretion scenario, higher mass planets are expected around more massive stars, Kennedy & Kenyon 2008; Mordasini et al. 2009). So far, RV and microlensing surveys revealed very few massive planets around M-stars (see, e.g., Batista et al. 2011), but these low mass stars show an abundance of light planets at short distance (Bonfils et al. 2013). At the other end of the stellar mass spectrum, several giant planets have been found around massive, evolved stars at orbital distances typically greater than 0.7 au (see, e.g., Johnson et al. 2011, and references there-in).
It is not yet clear how the stellar evolution impacts the observed planetary distributions and properties. The fact that transit surveys detect planets at very short periods seems to confirm an evolutionary effect. Close/intermediate separations must be investigated by observing massive main-sequence stars. Massive, early-type main-sequence stars show few spectral lines that are, in addition, generally broadened by a high stellar rotation rate (Galland et al. 2005, hereafter Paper I). Classical techniques used for solar-type stars, such as masking techniques, are therefore not adapted to these stars. In this context, we developed a tool, the Software for the Analysis of the Fourier Interspectrum Radial velocities (SAFIR), dedicated to the measurement of the RV in spectra of A-F type stars. This software is described in Paper I and is based on the Fourier interspectrum method (Chelli 2000). We initiated a survey dedicated to the search for extrasolar planets and brown dwarfs around a volume-limited sample of A-F main-sequence stars i) with the ELODIE fiber-fed echelle spectrograph (Baranne et al. 1996) mounted on the 1.93 m telescope at the Observatoire de Haute-Provence (OHP, France) in the northern hemisphere, and then with its successor SOPHIE (Bouchy & Sophie Team 2006), and ii) with the High-Accuracy Radial velocity Planet Searcher (HARPS) spectrograph (Pepe et al. 2002) mounted on the 3.6 m ESO telescope at La Silla Observatory (Chile) in the southern hemisphere. This survey has reported a few giant planets or planet candidates around some of its targets (Galland et al. 2005, 2006; Desort et al. 2008, 2009; Lagrange et al. 2012).
We present here the detection of a giant planet around HD 113337 observed in the course of our SP4 program with the SOPHIE Consortium (Bouchy et al. 2009). We present the stellar properties of HD 113337 in Sect. 2, and the SOPHIE data in Sect. 3. In Sect. 4, we discuss the origin of the observed RV variations, and we summarize our conclusions in Sect. 5.
2. Stellar characteristics
2.1. General properties
HD 113337 (HIP63584, HR4934) is a bright F6V star (Hoffleit & Jaschek 1991), located at 36.9 ± 0.4 pc from the Sun (van Leeuwen 2007). The main stellar parameters are reported in Table 1. Rhee et al. (2007) estimated a radius of 1.5 R⊙ from the stellar spectral energy distribution and the parallax. Reid et al. (2007) identified an M4 star companion (2MASS J13013268+6337496) at 120 arcsecs (≥4000 au). This companion is associated with an X-ray emission detected with the Röntgen-Satellite (ROSAT; Haakonsen & Rutledge 2009). An infrared (IR) excess was detected with the InfraRed Astronomical Satellite (IRAS) that Rhee et al. (2007) attributed to a cold dust of ~100 K in a ring at ~18 au from the star. On the other hand, using Spitzer data, Moór et al. (2011) estimated that the dust is located at 55 ± 3 au and has a temperature of 53 ± 1 K.
2.2. Age of the star
Several approaches to estimate the age of the star have led to different and initially incompatible results. The Geneva catalog assigns an age of 1.5 Gyr to HD 113337 (Holmberg et al. 2009) based on the Padova stellar evolution model (Holmberg et al. 2007). However, based on this model, most of the members of young associations (e.g., the Beta Pic moving group) are also assigned an age of 1−2 Gyr, much older than their actual age (<100 Myr). The same discrepancy is possible for HD 113337, and therefore, we do not rely on the age estimate based on this model. We know that F-type stars with effective temperature around 6600 K present a lithium (Li) gap that depends on the age (see, e.g., Boesgaard & Tripicco 1987). Our star’s effective temperature is estimated to be 6545 K (Boesgaard & Tripicco 1986). We therefore calculate its Li abundance and use the age-dependent relation derived by Boesgaard & Tripicco (1987) to estimate its age. A look at SOPHIE high signal-to-noise ratio (S/N) spectrum of the primary star shows no sign of the signature of the lithium line at 6707.8 Å. The analysis suggests an upper value for the equivalent width of this line to be 1 mÅ, which corresponds to an upper limit for the Li abundance in HD 113337 of A(Li) = 1.5 dex. This value was derived using the radiative transfer code Moog (Sneden 1973), and a grid of Kurucz Atlas 9 model atmospheres (Kurucz 1993). The input effective temperature and metallicity are the same as presented in Table 1. We compared the derived Li abundance with those of other Li-gap stars in the open cluster M35 (Steinhauer & Deliyannis 2004). The HD 113337 abundance value is lower than any of the Li abundances observed in this 160 ± 20 Myr cluster. Although some upper limit Li abundances are observed by Steinhauer & Deliyannis (2004), this result suggests that HD 113337 is likely older than ≃150 Myr. However, its Li abundance is however compatible with those observed in the older 700 Myr old Hyades cluster (Steinhauer & Deliyannis 2004). We note that Li abundances are most sensitive to the effective temperature (see, e.g., Israelian et al. 2004). However, adopting a slightly different value, for example by 100 K, will only change the derived Li abundance by 0.08 dex.
HD 113337 stellar properties.
On the other hand, we can determine the age from an analysis of the M dwarf companion detected by Reid et al. (2007). Rhee et al. (2007) estimated the age of the companion to be about 50 Myr based on its (K, V − KS) properties and showed that the galactic (U, V, W) motion of the system is typical of a young population. We did a more robust isochronal analysis, using absolute KS-band magnitude and a spectroscopic determination of the spectral type by Moór et al. (2011). We converged to a similar age of 40 ± 20 Myr, which is also incompatible with the Li age determination of the primary. This discrepancy could put the fact that the M star is actually a companion to HD 113337 into question. A recent Lucky-Imaging study by Janson et al. (2012) offered a way to reconcile the age estimations. These authors observed that the companion is a close, moderate brightness contrast M-type binary. Binarity affects the isochronal age estimation in two different ways that both work toward an older age. First, the actual absolute magnitude of the main component is fainter by 0.4 mag in KS-band when accounting for the flux coming from the secondary component. Second, the presence of a cooler companion biases the spectral type determination using unresolved spectra toward cooler temperature estimates. When accounting for both effects, we find that the primary component of the M dwarf companion has a temperature of 3350 ± 100 K and an absolute KS magnitude of 7.0. Using the BT-Settl isochrones of Allard et al. (2012) derived from the stellar evolution models of Chabrier et al. (2000), we find an age of 100 Myr. We note that our temperature estimate includes larger error bars than the estimation of Moór et al. (2011), which had an uncertainty of 70 K, as we corrected the systematic error in effective temperature arising from binarity. This correction is quite crude because we can only use one single low S/N point of resolved photometry (Δz′ = 0.9 ± 0.27, Janson et al. 2012). A solution to increase our accuracy would be to obtain resolved spectroscopy. This would permit us to establish whether the M-dwarf system is only a binary or contains more components.
Finally, using the constraints from both analysis, we adopt the most probable age of 150 Myr for the HD 113337AB system.
3. Spectroscopic data
3.1. Description of the observations
We obtained 312 high S/N spectra with SOPHIE, in the 3872−6943 Å range, in high-resolution mode (R ≈ 75 000 at 550 nm). The time span of the data is 2193 days, between Jan. 2007 and Jan. 2013, but all the date except three were taken after Feb. 2008. We adapted the exposure times (typically between 180 and 500 s) to obtain an average S/N of 155. We performed the exposures with simultaneous-thorium spectra to follow and correct for the drift of the instrument due to local temperature and pressure variations.
The RVs are computed using SAFIR. We selected spectra based on two criteria:
-
1.
the S/N must be greater than 80;
-
2.
the atmospheric absorption must be lower than three. For each spectrum, the absorption corresponds to the deviation between the stellar apparent magnitude in the V band and an empirical magnitude derived from the exposure time and the S/N.
We thus end up with 266 RV values. As HD 113337 is an F6 star, its spectra contain sufficient lines for the SOPHIE automatic data reduction software (DRS) to derive RVs (Bouchy et al. 2009). We verified that DRS RV values are consistent with the SAFIR values. Before June 2011, an instrumental effect due to the insufficient scrambling of one multimode fiber that led to non uniform illumination of the entrance of the spectrograph (Boisse et al. 2011a) was observed in the data (later referred as SOPHIE data). This effect was significantly decreased thanks to a fiber-link modification, which includes a piece of octagonal-section fiber (see Perruchot et al. 2011; Bouchy et al. 2013, later referred as SOPHIE+ data). We adapted the method of Díaz et al. (2012) to SAFIR to correct the SOPHIE data. The RVs quadratic mean is 57.1 m s-1, divided in 57.8 m s-1 and 43.8 m s-1 for SOPHIE and SOPHIE+ values, respectively. Accounting for 3.2 m s-1 of photon noise and 5 m s-1 of assumed instrumental stability, the RV uncertainty is 8.2 m s-1 on average for SOPHIE+ values. The error bars on the SOPHIE RVs also take the correction applied into account, and their average uncertainty is 12.4 m s-1. The RV measurements of HD 113337 are listed in Table 2 and are available at the Strasbourg astronomical Data Center (CDS). Columns 1 to 4 contain the time of the observation (barycentric Julian date), the RV, its error, and a flag to distinguish SOPHIE and SOPHIE+ values, respectively.
3.2. Radial velocity variations
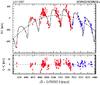 |
Fig. 1 Top: Keplerian fit of HD 113337 RV variations with a planet plus a quadratic law (SOPHIE and SOPHIE+ values are plotted in red and blue, respectively). Bottom: residuals of the fit as a function of time. |
The RV data are displayed in Fig. 1. They show a periodic signal with a peak-to-peak amplitude of about 300 m s-1 over the whole period of time considered, and of about 200 m s-1 if we consider only the data recorded in 2008 and later. Such amplitudes are much larger than the uncertainties (≃10 m s-1 on average, see above). The Lomb-Scargle periodogram of the RV variations is given in Fig. 2. It is calculated by SAFIR through an adapted version of the Clean algorithm (Roberts et al. 1987) and gives the normalized power spectrum of the RV data (i.e., the square modulus of the RV data Fourier transform) versus the period range. The significance of the periodogram peaks is tested thanks to the false alarm probabilities (FAP). The FAP are estimated using a bootstrapping approach, where the RV data are randomly shuffled and the corresponding periodograms are calculated. The highest peak is at a period of ~316 days (power = 82), which we will attribute to a planet (see below). A peak is also found at about 2146 days (power = 36), and some other peaks with a FAP smaller than 1% are found at 214 days (power = 20), 176 days (power = 18) and 157 days (power = 16), the latter being an alias of the planet period. Other smaller peaks of between 10 and 80 days can be attributed to the temporal sampling. In comparison, the periodogram of the window is also given as well as an example of a periodogram that would be induced by a planet on a circular orbit with a period of 316 days. As expected, apart from the peak at the planet period, several other peaks, due to the temporal sampling, are also observed at periods similar those observed.
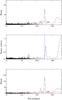 |
Fig. 2 Top: periodogram of HD 133337 RVs. The false alarm probabilities at 1 and 10% are drawn in red dashed lines. Middle: periodogram of the temporal sampling of the data. The 316 day period is indicated by a blue line. Note the difference in the y-scale. Bottom: periodogram of simulated RVs of a star hosting a planet on a circular orbit with a 316 day period. The temporal sampling is the same than for HD 113337 data. |
3.3. Line profile variations
The SOPHIE automatic pipeline cross-correlates the spectra with a G2-type mask. This is relevant as this spectral type is near that of HD 113337. Each resulting cross-correlation function (CCF) is fitted by a Gaussian. Two parameters of the CCF, the bisector velocity span (BIS) and the full width at half maximum (FWHM), allow the monitoring of line profile deformations that could induce RV variations not related to a Doppler shift due to orbital motion.
We show in Fig. 3 the BIS as a function of time and its Lomb-Scargle periodogram, with values of FAP. No BIS temporal variations are seen with a period of ≃300 days, and the periodogram does not show any peak at 300−400 days. But a long-term low amplitude BIS variation is seen highlighted by the highest peak in the periodogram at a period greater than 1000 days. No significant correlation is seen between RVs and BISs (i.e., Pearson’s correlation coefficient <0.4).
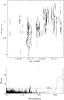 |
Fig. 3 Top: BIS versus time. Bottom: periodogram of the BIS variations. |
The temporal variations of the FWHM of the CCF are reported in Fig. 4. We do not see any variability with periods in the range of 300 day, but we see a low amplitude long-term variation. The FWHM values are well correlated with those of the BIS (see Fig. 4).
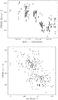 |
Fig. 4 Top: temporal variations of the FWHM of the CCF. Bottom: FWHM versus BISs. |
4. Origins of the observed periodic RV variations
We observe both a 320 day periodic variability and a long-term variability in the RV signal. We first note that given its very large projected separation, the M-type companions have no detectable impact on the spectrum and the RV variations of HD 113337. The weak long-term variations observed in the BIS and the FWHM of the CCFs are well correlated and present a long-term trend similar to the RV. This indicates that the long-term signal is most probably not related to a gravitationally-bound companion, but may be associated with long-term stellar variability such as convection effects. In the following section we discuss the 320 day periodic RV variation.
4.1. Stellar variability
Stellar pulsations are an improbable origin for the RV variations as they would also induce significant BIS variations (see examples in Galland et al. 2006) and because a ≥300 day periodicity is far larger than those of pulsations known for this type of main-sequence stars. We exclude stellar spots as they would lead to signals with periods of a few days or less. If we assume a radius of 1.5 R⊙ and a vsini of 6.1 km s-1, the rotation period would be less than 12 days. This is clearly not compatible with the observed ≃320 day period. A mean log value of −4.8 is derived (Boisse et al. 2010), which excludes a high level of activity and no variability is seen in the log data. With this level of vsini (i.e. >6 km s-1), activity-induced RV variations would induce correlated BIS variations. The fact that no periodic signal is seen in the BIS at a period of 320 days allows us to dismiss stellar activity as an explanation for the 320 day variations (see Desort et al. 2007; Boisse et al. 2011b). We thus attribute them to the presence of a planetary companion.
4.2. A planet orbiting around HD 113337
We fitted the RV data of HD 113337 with a Keplerian model and a quadratic law simultaneously using a Levenberg-Marquardt algorithm, after selecting values with a genetic algorithm (Ségransan et al. 2011). We treated the corrected SOPHIE and SOPHIE+ data as independent samples. The best solution is an eccentric orbit (e = 0.46 ± 0.04) with a period of  days and a semi-amplitude of
  m s-1. Taking the error bar on the stellar mass (M⋆ = 1.40 ± 0.14 M⊙) into account, the RV signature corresponds to a planet of minimum mass mPsini = 2.83 ± 0.24 MJup. The best-fit Keplerian model is plotted, superimposed on the SOPHIE and SOPHIE+ velocities, in Fig. 1. The final orbital elements are listed in Table 3. We computed them using 5000 Monte Carlo simulations and the uncertainties in the final parameters correspond to their 1-sigma confidence intervals. The difference between the mean RV values from SOPHIE and SOPHIE+ is consistent with observations from constant stars (Bouchy et al. 2013). We checked that removing the first three data points does not change the parameters of the fit within 1-σ.
The residuals are greater than the mean error bars, ~25 and ~19 m s-1 for SOPHIE and SOPHIE+, respectively. However, no periodic variation is detected. This high variability may originate both from an underestimation of the instrument stability and from contaminant signal (e.g., moonlight).
Best orbital solutions for HD 113337 RVs.
5. Discussion and concluding remarks
Using our age estimation, HD 113337 would be a particularly young planetary system detected by RV. As of yet, very few RV planets have been found around young stars. A giant planet of 6.1 ± 0.4 MJup was reported around the ~100 Myr-old G1V star HD 70573 (Setiawan et al. 2007). More recently, van Eyken et al. (2012) reported a possible close-in giant planet around a 7−10 Myr old T Tauri star, using both photometric and spectroscopic observations. One has to be particularly cautious when finding periodic RV variations that can be attributed to a planet because young stars are very active and rapidly rotating objects. Stellar activity manifestations, such as cold spots, could mimic planet signatures, particularly with periodicity smaller or close to the stellar rotation period. There are some cases of RV signals initially announced as planet signatures that later became controversial or were even rejected. An example is the signature of a 10 ± 3 MJup planet reported by Setiawan et al. (2008) around TW Hya (8−10 Myr) which turned out to be the trace of a cold stellar spot, according to Huélamo et al. (2008) and to Figueira et al. (2010b). Another case is the ~6.5 ± 0.5 MJup planet reported around the young (35−80 Myr) active K5V dwarf BD+201790 (Hernán-Obispo et al. 2010), which Figueira et al. (2010a) later rejected. In the case of HD 113337 the reasons that lead to such false detections can be rejected: i) the 324 day period is far greater than the estimated stellar rotational period; ii) the level of stellar activity is much lower than for the mentioned cases; and iii) with a stellar vsini> 6 km s-1, RV variations induced by line profiles deformations would have been monitored by the BIS and FWHM parameters, which is not the case.
Interestingly, HD 113337b properties are similar to those of the companion of 30 Ari B (Guenther et al. 2009), which has an orbital period and an eccentricity very close to those of HD 113337b, and a ~9.9 MJup minimum mass. 30 Ari B is a ≃1.1 M⊙ F4V star, with Teff = 6462 K and a higher vsini of ≃38 km s-1. According to the age estimation made by these authors (0.91 ± 0.83 Gyr), it is much likely older than HD 113337. Whether the masses of 30 Ari Bb and HD 113337b are similar depends on the actual stars’ rotational velocity and on the inclination of the systems, both of which are unknown. We note that in the catalog of F-type dwarf velocities of Nordstrom et al. (1997), the mean vsini of 72 F4-F6 stars is about 49 km s-1, while it is about 16 km s-1 in our 49 F4-F6 star sample. According to Guenther et al. (2009), the rotational rate of 30 Ari B indicates that this star is probably seen almost equator-on, or with a small inclination. On the contrary, HD 113337 vsini is significantly lower than the average values for the two mentioned samples. Combined with the fact that it is a young star, this could indicate a large inclination (and hence a low vsini). If we assume an actual rotational velocity of 16 km s-1 for HD 113337, then it would lead to a ~20° inclination for our star. If the orbital and the stellar spin axes were aligned, 30 Ari Bb and HD 113337b would then have almost the same mass. However, this is quite speculative at this stage.
Young planetary systems are of particular interest as they can be targeted both by RV and by forthcoming deep imagers (such as the Spectro Polarimetric High-contrast Exoplanet REsearch (SPHERE) on the Very Large Telescope). Detecting planets both in RV and imaging is an important goal as it would give the opportunity to calibrate the brightness-mass relationships at young ages. These relationships are used to derive masses in imaging, and are still producing diverging results at young ages (see, e.g., Fortney et al. 2008). An example of the kind of constrains derived when combining RV and imaging on a yet more distant target can be found in Lagrange et al. (2012).
Given its V-magnitude and declination, HD 113337 is a good target for an interferometric instrument such as the Visible spEctroGraph and polArimeter (VEGA), operating at the Mount Wilson Observatory. If we used the largest baselines of the Center for High Angular Resolution Array (CHARA), the star could be partially resolved, allowing us to accurately determine its angular diameter and to derive precise values of the stellar radius and mass (the mass can be deduced thanks to the radius and surface gravity, see Ligi et al. 2012). Thus the Keplerian model of the planet could be better constrained. An example of particular interest is the case of the F-type star HD 185395, for which a variability of the stellar angular diameter was detected (Ligi et al. 2012). This variability is still of unknown origin, and has the same periodicity as RV variations previously observed (Desort et al. 2009).
This system is also interesting as it hosts a planet and a debris disk at the same time. From a statistical point of view, there is no well defined correlation between RV planets and IR excesses due to cold debris disks around solar-type stars. But it is not clear whether the absence of correlation is due to effect of evolution (the stars surveyed in RV are mature stars) or to other biases (the planets are at rather short separations). In a recent paper, Wyatt et al. (2012) suggested that systems composed of only small-mass planets (mPsini< Saturn mass) also host a debris disk preferentially. Although their result is subject to small number statistics, they proposed that this correlation could be a signature of dynamically stable systems where planetesimals can remain unperturbed over a Gyr timescale. We also note that stars with imaged planets (at large separations) are surrounded by disks and are young. Many more systems like HD 113337 are needed to further test the link between the debris disks and the presence of planets from an evolutionary point of view. Finally, high resolution imaging data of the inner part of the disk would be valuable to search for possible signs of disk-planet interactions.
Acknowledgments
We acknowledge support from the French CNRS and the support from the Agence Nationale de la Recherche (ANR grant ANR BLANC 10-0504.01). We are grateful to the Observatoire de Haute-Provence (OHP) for their help during the observations, and to the Programme National de Planétologie (PNP, INSU). These results have made use of the SIMBAD database, operated at CDS, Strasbourg, France. We also thank Gérard Zins and Sylvain Cètre for their help in implementing the SAFIR interface. N.C.S., I.B. and A.S. acknowledge the support by the European Research Council/European Community under the FP7 through Starting Grant agreement number 239953. N.C.S. and I.B. also acknowledges the support from Fundação para a Ciência e a Tecnologia (FCT) through program Ciência 2007 funded by FCT/MCTES (Portugal) and POPH/FSE (EC), and in the form of grants reference PTDC/CTE-AST/098528/2008 and PTDC/CTE-AST/098604/2008, and SFRH/BPD/81084/2011. A.E. is supported by a fellowship for advanced researchers from the Swiss National Science Foundation (grant PA00P2_126150/1) and RFD is supported by CNES. We gratefully acknowledge the comments and suggestions of the referee, A. Hatzes, which helped to improve the quality of the paper.
References
- Allard, F., Homeier, D., & Freytag, B. 2012, Roy. Soc. London Philos. Trans. Ser. A, 370, 2765 [Google Scholar]
- Allen de Prieto, C., & Lambert, D. L. 1999, A&A, 352, 555 [NASA ADS] [Google Scholar]
- Baranne, A., Queloz, D., Mayor, M., et al. 1996, A&AS, 119, 373 [NASA ADS] [CrossRef] [EDP Sciences] [Google Scholar]
- Batista, V., Gould, A., Dieters, S., et al. 2011, A&A, 529, A102 [NASA ADS] [CrossRef] [EDP Sciences] [Google Scholar]
- Boesgaard, A. M., & Tripicco, M. J. 1986, ApJ, 303, 724 [NASA ADS] [CrossRef] [Google Scholar]
- Boesgaard, A. M., & Tripicco, M. J. 1987, ApJ, 313, 389 [NASA ADS] [CrossRef] [Google Scholar]
- Boisse, I., Eggenberger, A., Santos, N. C., et al. 2010, A&A, 523, A88 [NASA ADS] [CrossRef] [EDP Sciences] [Google Scholar]
- Boisse, I., Bouchy, F., Chazelas, B., et al. 2011a, in Eur. Phys. J. Web Conf., 16, 2003 [Google Scholar]
- Boisse, I., Bouchy, F., Hébrard, G., et al. 2011b, A&A, 528, A4 [NASA ADS] [CrossRef] [EDP Sciences] [Google Scholar]
- Bonfils, X., Delfosse, X., Udry, S., et al. 2013, A&A, 549, A109 [NASA ADS] [CrossRef] [EDP Sciences] [Google Scholar]
- Bouchy, F., & Sophie Team 2006, in Tenth Anniversary of 51 Peg-b: Status of and prospects for hot Jupiter studies, eds. L. Arnold, F. Bouchy, & C. Moutou, 319 [Google Scholar]
- Bouchy, F., Hébrard, G., Udry, S., et al. 2009, A&A, 505, 853 [NASA ADS] [CrossRef] [EDP Sciences] [Google Scholar]
- Bouchy, F., Díaz, R. F., Hébrard, G., et al. 2013, A&A, 549, A49 [NASA ADS] [CrossRef] [EDP Sciences] [Google Scholar]
- Chabrier, G., Baraffe, I., Allard, F., & Hauschildt, P. 2000, ApJ, 542, 464 [NASA ADS] [CrossRef] [Google Scholar]
- Chelli, A. 2000, A&A, 358, L59 [NASA ADS] [Google Scholar]
- Desort, M., Lagrange, A.-M., Galland, F., Udry, S., & Mayor, M. 2007, A&A, 473, 983 [NASA ADS] [CrossRef] [EDP Sciences] [Google Scholar]
- Desort, M., Lagrange, A.-M., Galland, F., et al. 2008, A&A, 491, 883 [NASA ADS] [CrossRef] [EDP Sciences] [Google Scholar]
- Desort, M., Lagrange, A.-M., Galland, F., et al. 2009, A&A, 506, 1469 [NASA ADS] [CrossRef] [EDP Sciences] [Google Scholar]
- Díaz, R. F., Santerne, A., Sahlmann, J., et al. 2012, A&A, 538, A113 [NASA ADS] [CrossRef] [EDP Sciences] [Google Scholar]
- Figueira, P., Marmier, M., Bonfils, X., et al. 2010a, A&A, 513, L8 [NASA ADS] [CrossRef] [EDP Sciences] [Google Scholar]
- Figueira, P., Pepe, F., Santos, N. C., et al. 2010b, in EAS Pub. Ser. 42, eds. K. Gożdziewski, A. Niedzielski, & J. Schneider, 125 [Google Scholar]
- Fortney, J. J., Marley, M. S., Saumon, D., & Lodders, K. 2008, ApJ, 683, 1104 [NASA ADS] [CrossRef] [Google Scholar]
- Galland, F., Lagrange, A.-M., Udry, S., et al. 2005, A&A, 443, 337 [NASA ADS] [CrossRef] [EDP Sciences] [Google Scholar]
- Galland, F., Lagrange, A.-M., Udry, S., et al. 2006, A&A, 452, 709 [NASA ADS] [CrossRef] [EDP Sciences] [Google Scholar]
- Guenther, E. W., Hartmann, M., Esposito, M., et al. 2009, A&A, 507, 1659 [NASA ADS] [CrossRef] [EDP Sciences] [Google Scholar]
- Haakonsen, C. B., & Rutledge, R. E. 2009, ApJS, 184, 138 [NASA ADS] [CrossRef] [Google Scholar]
- Hernán-Obispo, M., Gálvez-Ortiz, M. C., Anglada-Escudé, G., et al. 2010, A&A, 512, A45 [NASA ADS] [CrossRef] [EDP Sciences] [Google Scholar]
- Hoffleit, D., & Jaschek, C. 1991, The Bright star catalogue (New Haven, Comm: Yale University Observatory) [Google Scholar]
- Holmberg, J., Nordström, B., & Andersen, J. 2007, A&A, 475, 519 [NASA ADS] [CrossRef] [EDP Sciences] [MathSciNet] [Google Scholar]
- Holmberg, J., Nordström, B., & Andersen, J. 2009, A&A, 501, 941 [NASA ADS] [CrossRef] [EDP Sciences] [Google Scholar]
- Huélamo, N., Figueira, P., Bonfils, X., et al. 2008, A&A, 489, L9 [NASA ADS] [CrossRef] [EDP Sciences] [Google Scholar]
- Israelian, G., Santos, N. C., Mayor, M., & Rebolo, R. 2004, A&A, 414, 601 [NASA ADS] [CrossRef] [EDP Sciences] [Google Scholar]
- Janson, M., Hormuth, F., Bergfors, C., et al. 2012, ApJ, 754, 44 [NASA ADS] [CrossRef] [Google Scholar]
- Johnson, J. A., Clanton, C., Howard, A. W., et al. 2011, ApJS, 197, 26 [NASA ADS] [CrossRef] [Google Scholar]
- Kennedy, G. M., & Kenyon, S. J. 2008, ApJ, 673, 502 [NASA ADS] [CrossRef] [Google Scholar]
- Kurucz, R. 1993, ATLAS9 Stellar Atmosphere Programs and 2 km s-1 grid. Kurucz CD-ROM No. 13 (Cambridge, Mass.: Smithsonian Astrophysical Observatory, 1993) [Google Scholar]
- Lagrange, A.-M., De Bondt, K., Meunier, N., et al. 2012, A&A, 542, A18 [NASA ADS] [CrossRef] [EDP Sciences] [Google Scholar]
- Ligi, R., Mourard, D., Lagrange, A. M., et al. 2012, A&A, 545, A5 [NASA ADS] [CrossRef] [EDP Sciences] [Google Scholar]
- Mayor, M., & Queloz, D. 1995, Nature, 378, 355 [NASA ADS] [CrossRef] [Google Scholar]
- Mayor, M., Marmier, M., Lovis, C., et al. 2011, A&A, submitted [arXiv:1109.2497] [Google Scholar]
- Moór, A., Pascucci, I., Kóspál, Á., et al. 2011, ApJS, 193, 4 [NASA ADS] [CrossRef] [Google Scholar]
- Mordasini, C., Alibert, Y., Benz, W., & Naef, D. 2009, A&A, 501, 1161 [NASA ADS] [CrossRef] [EDP Sciences] [Google Scholar]
- Nordstrom, B., Stefanik, R. P., Latham, D. W., & Andersen, J. 1997, A&AS, 126, 21 [NASA ADS] [CrossRef] [EDP Sciences] [Google Scholar]
- Pepe, F., Mayor, M., Rupprecht, G., et al. 2002, The Messenger, 110, 9 [NASA ADS] [Google Scholar]
- Perruchot, S., Bouchy, F., Chazelas, B., et al. 2011, in SPIE Conf. Ser., 8151 [Google Scholar]
- Perryman, M. A. C., & ESA 1997, The Hipparcos and TYCHO catalogues. Astrometric and photometric star catalogues derived from the ESA Hipparcos Space Astrometry Mission, ESA SP, 1200 [Google Scholar]
- Reid, I. N., Cruz, K. L., & Allen, P. R. 2007, AJ, 133, 2825 [NASA ADS] [CrossRef] [Google Scholar]
- Rhee, J. H., Song, I., Zuckerman, B., & McElwain, M. 2007, ApJ, 660, 1556 [NASA ADS] [CrossRef] [MathSciNet] [Google Scholar]
- Roberts, D. H., Lehar, J., & Dreher, J. W. 1987, AJ, 93, 968 [NASA ADS] [CrossRef] [Google Scholar]
- Schneider, J., Dedieu, C., Le Sidaner, P., Savalle, R., & Zolotukhin, I. 2011, A&A, 532, A79 [NASA ADS] [CrossRef] [EDP Sciences] [Google Scholar]
- Ségransan, D., Mayor, M., Udry, S., et al. 2011, A&A, 535, A54 [NASA ADS] [CrossRef] [EDP Sciences] [Google Scholar]
- Setiawan, J., Weise, P., Henning, T., et al. 2007, ApJ, 660, L145 [NASA ADS] [CrossRef] [Google Scholar]
- Setiawan, J., Henning, T., Launhardt, R., et al. 2008, Nature, 451, 38 [NASA ADS] [CrossRef] [PubMed] [Google Scholar]
- Sneden, C. A. 1973, Ph.D. thesis, The University of Texas at Austin [Google Scholar]
- Steinhauer, A., & Deliyannis, C. P. 2004, ApJ, 614, L65 [NASA ADS] [CrossRef] [Google Scholar]
- van Eyken, J. C., Ciardi, D. R., von Braun, K., et al. 2012, ApJ, 755, 42 [NASA ADS] [CrossRef] [Google Scholar]
- van Leeuwen, F. 2007, A&A, 474, 653 [NASA ADS] [CrossRef] [EDP Sciences] [Google Scholar]
- Wyatt, M. C., Kennedy, G., Sibthorpe, B., et al. 2012, MNRAS, 424, 1206 [NASA ADS] [CrossRef] [Google Scholar]
All Tables
All Figures
|
Fig. 1 Top: Keplerian fit of HD 113337 RV variations with a planet plus a quadratic law (SOPHIE and SOPHIE+ values are plotted in red and blue, respectively). Bottom: residuals of the fit as a function of time. |
| In the text | |
|
Fig. 2 Top: periodogram of HD 133337 RVs. The false alarm probabilities at 1 and 10% are drawn in red dashed lines. Middle: periodogram of the temporal sampling of the data. The 316 day period is indicated by a blue line. Note the difference in the y-scale. Bottom: periodogram of simulated RVs of a star hosting a planet on a circular orbit with a 316 day period. The temporal sampling is the same than for HD 113337 data. |
| In the text | |
|
Fig. 3 Top: BIS versus time. Bottom: periodogram of the BIS variations. |
| In the text | |
|
Fig. 4 Top: temporal variations of the FWHM of the CCF. Bottom: FWHM versus BISs. |
| In the text | |
Current usage metrics show cumulative count of Article Views (full-text article views including HTML views, PDF and ePub downloads, according to the available data) and Abstracts Views on Vision4Press platform.
Data correspond to usage on the plateform after 2015. The current usage metrics is available 48-96 hours after online publication and is updated daily on week days.
Initial download of the metrics may take a while.