Free Access
Fig. 10
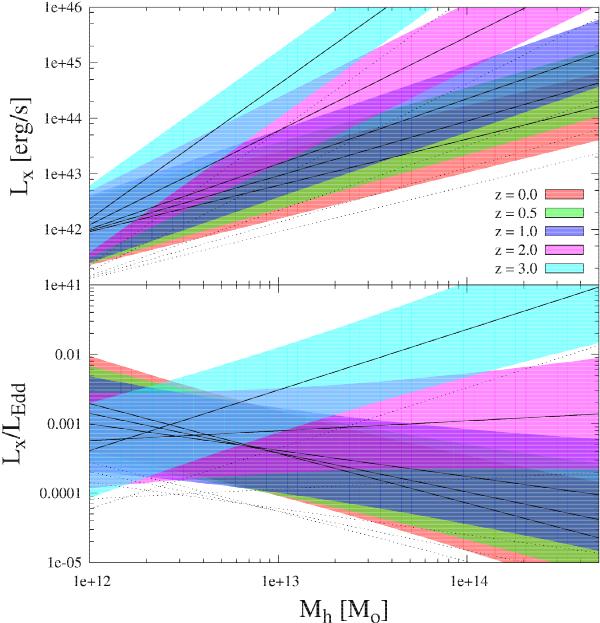
Analog of Fig. 6 for the last model in Table 3, i.e., for the model with LX-dependent fduty and with scatter in Mh − LX scaling relation. The solid lines surrounded by the shaded areas show distribution medians along with regions between 16% and 84% quantiles, respectively. Dotted lines represent modes of the distributions.
Current usage metrics show cumulative count of Article Views (full-text article views including HTML views, PDF and ePub downloads, according to the available data) and Abstracts Views on Vision4Press platform.
Data correspond to usage on the plateform after 2015. The current usage metrics is available 48-96 hours after online publication and is updated daily on week days.
Initial download of the metrics may take a while.