Fig. 7
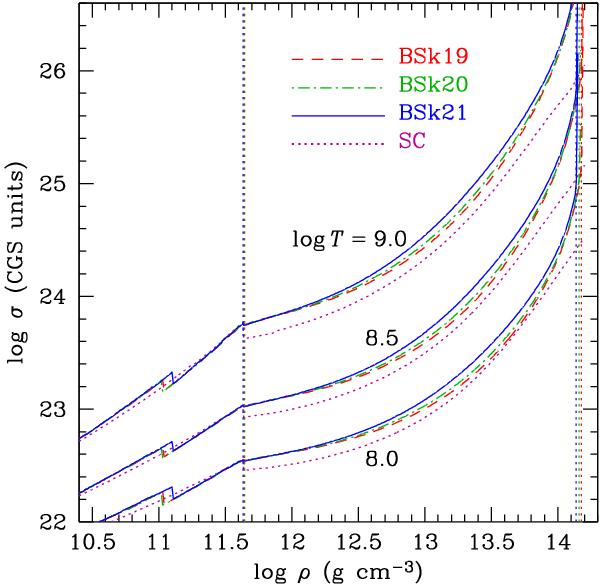
Electrical conductivity σ of the neutron-star crust with nuclear parameters given by the models BSk19 (dashed lines), BSk20 (dot-dashed lines), BSk21 (solid lines), and the smooth-composition (SC) model (dotted curves) as functions of mass density ρ for T = 108 K, 108.5 K, and 109 K. The vertical dotted lines show the boundaries nd and ncc of the inner crust according to the three BSk models (Table 7).
Current usage metrics show cumulative count of Article Views (full-text article views including HTML views, PDF and ePub downloads, according to the available data) and Abstracts Views on Vision4Press platform.
Data correspond to usage on the plateform after 2015. The current usage metrics is available 48-96 hours after online publication and is updated daily on week days.
Initial download of the metrics may take a while.