| Issue |
A&A
Volume 560, December 2013
|
|
|---|---|---|
| Article Number | A7 | |
| Number of page(s) | 18 | |
| Section | Interstellar and circumstellar matter | |
| DOI | https://doi.org/10.1051/0004-6361/201221023 | |
| Published online | 28 November 2013 | |
A Herschel study of NGC 650⋆,⋆⋆
1 Royal Observatory of Belgium, Ringlaan 3, 1180 Brussels, Belgium
e-mail: This email address is being protected from spambots. You need JavaScript enabled to view it.
2 Instituut voor Sterrenkunde, Katholieke Universiteit Leuven, Celestijnenlaan 200 D, 3001 Leuven, Belgium
3 Dept of Physics & Astronomy, University College London, Gower St, London WC1E 6BT, UK
4 Dept. of Physics and Astronomy, University of Denver, Mail Stop 6900, Denver, CO 80208, USA
5 School of Physics and Astronomy, Cardiff University, 5 The Parade, Cardiff, Wales CF24 3YB, UK
6 UK Astronomy Technology Centre, Royal Observatory Edinburgh, Blackford Hill, Edinburgh EH9 3HJ, UK
7 Space Science and Technology Department, Rutherford Appleton Laboratory, Oxfordshire, OX11 0QX, UK
8 Dept. of Astronomy, Stockholm University, AlbaNova University Center, Roslagstullsbacken 21, 10691 Stockholm, Sweden
9 Department of Physics, University of Lethbridge, Lethbridge, Alberta, T1J 1B1, Canada
Received: 31 December 2012
Accepted: 26 July 2013
Abstract
As part of the Herschel guaranteed time key project Mass loss of Evolved StarS (MESS) we have imaged a sample of planetary nebulae. In this paper we present the Photodetector Array Camera and Spectrometer (PACS) and Spectral and Photometric Imaging Receiver (SPIRE) images of the classical bipolar planetary nebula NGC 650. We used these images to derive a temperature map of the dust. We also constructed a photoionization and dust radiative transfer model using the spectral synthesis code Cloudy. To constrain this model, we used the PACS and SPIRE fluxes and combined them with hitherto unpublished International Ultraviolet Explorer (IUE) and Spitzer InfraRed Spectrograph (IRS) spectra as well as various other data from the literature. A temperature map combined with a photoionization model were used to study various aspects of the central star, the nebula, and in particular the dust grains in the nebula. The central star parameters are determined to be Teff = 208 kK and L = 261 L⊙ assuming a distance of 1200 pc. The stellar temperature is much higher than previously published values. We confirm that the nebula is carbon-rich with a C/O ratio of 2.1. The nebular abundances are typical for a type IIa planetary nebula. With the photoionization model we determined that the grains in the ionized nebula are large (assuming single-sized grains, they would have a radius of 0.15 μm). Most likely these large grains were inherited from the asymptotic giant branch phase. The PACS 70/160 μm temperature map shows evidence of two radiation components heating the grains. The first component is direct emission from the central star, while the second component is diffuse emission from the ionized gas (mainly Lyα). We show that previous suggestions of a photo-dissociation region surrounding the ionized region are incorrect. The neutral material resides in dense clumps inside the ionized region. These may also harbor stochastically heated very small grains in addition to the large grains.
Key words: planetary nebulae: individual: NGC 650 / circumstellar matter / dust, extinction / infrared: ISM / ISM: molecules
Herschel is an ESA space observatory with science instruments provided by European-led Principal Investigator consortia and with important participation from NASA.
Tables 2–5 are available in electronic form at http://www.aanda.org
© ESO, 2013
1. Introduction
As part of the Herschel guaranteed time key project Mass loss of Evolved StarS (MESS; PI Martin Groenewegen) we have imaged a sample of planetary nebulae (PNe) with the Photodetector Array Camera and Spectrometer (PACS; Poglitsch et al. 2010) and Spectral and Photometric Imaging Receiver (SPIRE; Griffin et al. 2010) instruments on board the Herschel satellite (Pilbratt et al. 2010). A detailed description of the program can be found in Groenewegen et al. (2011). The main aims of the MESS program are twofold, namely (1) to study the structure of the circumstellar envelope and time evolution of the mass-loss rate; and (2) to study molecular and solid-state features in the spectra of a representative sample of low-, intermediate-, and high-mass post-main sequence objects. An overview of the Herschel observations for PNe can be found in van Hoof et al. (2012). In this article we will present the Herschel observations of the PN NGC 650.
The nebula NGC 650 (M 76, Little Dumbbell Nebula) is a large (~300′′; Balick et al. 1992) bipolar planetary nebula (PN) of the late butterfly type (Balick et al. 1987). It is a prototypical example of a bipolar PN. The generally accepted model for the formation of these PNe is the generalized interacting stellar winds model (GISW; Balick et al. 1987) in which the progenitor has lost a considerable amount of mass while on the asymptotic giant branch (AGB), culminating in the superwind. The GISW model depends on the degree of equator to pole density contrast in the AGB wind to produce a wide variety of shapes, which superficially may appear quite different. One reason for studying NGC 650 is that it has historically been linked to the Ring nebula (NGC 6720, Minkowski & Osterbrock 1960), which is also part of the MESS program (van Hoof et al. 2012). The nebula NGC 6720 is an evolved, oxygen-rich bipolar nebula seen nearly pole-on (O’Dell et al. 2007; van Hoof et al. 2010), while NGC 650 is thought to be carbon rich (Kwitter & Henry 1996). Both nebulae have a highly evolved central star and exhibit small-scale density variations and irregularities in the nebula on a larger scale. In this paper we investigate the dust properties of NGC 650 using Cloudy modeling as we did for the Ring nebula in van Hoof et al. (2010).
The nebula NGC 650 is well studied. The optical and mid-infrared (IR) properties of NGC 650 have been studied by Ramos-Larios et al. (2008), the far-IR Spitzer emission by Ueta (2006), the kinematical properties by Bryce et al. (1996), and the H2 emission by Marquez-Lugo et al. (2013), and references therein.
The nebular structure in the optical consists of a bright rectangular core of 100′′ × 40′′ (the long side perpendicular to the bipolar axis) and a pair of fainter lobes extending ~90′′ and ~150′′ from the central star (Balick et al. 1992). The optical low-excitation intensity ratio maps show evidence for a complex and clumpy structure throughout the source, located in the central bar-like feature (where it appears to be particularly prominent), the semicircular extended lobes, as well as the weaker emission beyond these lobes (Ramos-Larios et al. 2008).
The most recent kinematical study has demonstrated that the core is an inclined torus and the lobes are blown bubbles expanding in the polar directions (Bryce et al. 1996). The torus probably takes the form of a tilted napkin-ring type structure inclined at about 75° to the line of sight such that the NW lobe extends toward the observer and the SE lobe extends away. This torus is expanding at a velocity of ~43 km s-1, while the bright semicircular lobes are observed to expand at ~60 km s-1, and the fainter outer shell appears to have vexp ~ 5 km s-1.
The mid-IR emission at 5.8 and 8 μm is probably composed of polycyclic aromatic hydrocarbon (PAH) emission bands and is associated with the nebular photo-dissociation region (PDR; Ramos-Larios et al. 2008). Ramos-Larios et al. (2008) suggest that much of the fainter emission outside the bipolar lobes may arise as a result of leakage of radiation from the clumpy interior lobes.
The far-IR surface brightness distribution shows two emission peaks at all three Multiband Imaging Photometer for Spitzer (MIPS) bands (Ueta 2006). These peaks represent the limb-brightened edges of a nearly edge-on, optically thin dusty torus. The 70 and 160 μm emission comes from low-temperature dust (~30 K, see Sect. 3.4) in the remnant AGB wind shell. The 24 μm emission is in part due to the [O iv] line at 25.9 μm arising from the highly ionized part of the inner torus, which has been engulfed by the ionization front, and the ionized matter that has advected off the torus and filled the inner cavity of the torus. However, part of the 24 μm emission also comes from dust grains. This is discussed further in Sect. 4.6.
Molecular hydrogen emission arises from clumps embedded within the ionized torus (Marquez-Lugo et al. 2013). The H2 observations resolve the torus into a series of disconnected knots and filaments. Some knots are also detected in the inner regions of the bipolar lobes. The H2 emission is not constrained to the waist only. No CO emission has been detected in NGC 650 (Huggins & Healy 1989; Huggins et al. 1996) in the regions where the H2 emission is strongest.
This PN has a hydrogen deficient central star of type PG 1159 (E) with estimated parameters Teff = 140 kK, log g = 7.0, and Mcore = 0.60 M⊙ (Napiwotzki & Schönberner 1995). These values were derived by comparison to the very similar optical spectrum of PG 1159 itself, which was extensively studied by Werner et al. (1991). We note however, that the NGC 650 spectrum used by Napiwotzki & Schönberner (1995) is of fairly low quality (see their Fig. 7) so that it is hard to assess the accuracy of these parameters. See also the discussion in Sect. 4.1. The position of the central star is 
 (J2000).
The distance to the PN is 1200 pc (Koornneef & Pottasch 1998). This value is a so-called gravity distance. It is derived by comparing the stellar atmosphere model combined with the log g value (which gives the absolute luminosity of the star) with the observed V band magnitude after correcting for the extinction. Given the uncertainty in the central star parameters discussed above and the non-standard extinction in the nebula (see Sect. 3.5) this value should probably be considered uncertain.
In Sect. 2 we discuss the reduction of the PACS and SPIRE data and present the images. In Sect. 3 we discuss the photoionization and dust radiative transfer model of NGC 650 that we created as well as the data that we collected to constrain this model. In Sect. 4 we will give a full discussion of our results and finally in Sect. 5 we will present our main conclusions.
2. Herschel data
The nebula NGC 650 has been imaged in scan map mode. With PACS we have obtained images in the 70 and 160 μm bands, with SPIRE in the 250, 350, and 500 μm bands. For PACS we used a scan speed of 20 arcsec/s and for SPIRE the nominal 30 arcsec/s. The PACS and SPIRE data were reduced up to level 1 within the data procession package Herschel interactive data processing environment (HIPE; Ott 2010) v9.0 and using the calibration files PACS_cal_41 and SPIRE_cal_9.1, respectively. The PACS and SPIRE images were made with the code Scanamorphos version 18 (Roussel 2013). We used the standard pixel sizes in Scanamorphos which are 1.40 arcsec/pixel for the 70 μm image, 2.85 arcsec/pixel for the 160 μm image, and 4.50, 6.25, 9.00 arcsec/pixel for SPIRE at 250, 350, 500 μm, respectively. The Herschel beams have a complicated structure and are elongated as a result of the scanning. The full width at half maximum (FWHM) is approximately 6.0 × 5.5 arcsec for the 70 μm map and 12.0 × 10.5 arcsec for the 160 μm map. The FWHM of the SPIRE beams are 18.3 × 17.0 arcsec for 250 μm, 24.7 × 23.2 arcsec for 350 μm, and 37.0 × 33.4 arcsec for 500 μm. The resulting images in Jy/pixel are shown in Figs. 1–5. The background sources were subtracted. Then the background was measured over several regions around the object in the map. After background subtraction, we measured fluxes within the signal-to-noise ratio =1 contour in a region around the object. The resulting fluxes are shown in the second column of Table 1 combined with fluxes derived from the Infrared Astronomical Satellite (IRAS; IPAC 1986) and Spitzer (Ueta 2006) observations.
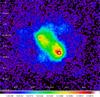 |
Fig. 1 PACS 70 μm image of NGC 650 shown on a sqrt stretch. The color bar shows the flux density normalized in Jy/pixel. |
To produce flux ratio images, the background subtracted images were convolved using the appropriate convolution kernels (May 2012) of Aniano et al. (2011) and rebinned to the pixel size of the longest wavelength image with flux conservation in IDL using conv_image.pro written by Karl D. Gordon at STScI. To convert the flux ratio images to temperature maps, we determined the theoretical flux ratio at a given grain temperature by folding the grain emissivity of astronomical graphite (Martin & Rouleau 1991) with the PACS and SPIRE filter transmission curves in HIPE (v8.2.0) using the procedure outlined in the SPIRE Observer’s Manual. The use of graphite is justified by our finding that the C/O ratio is larger than 1 (see Sect. 4.3). We interpolated the flux ratio as a function of temperature for each pixel in the flux ratio image to obtain the temperature map. This map is discussed in Sect. 4.6. The procedure for making the temperature map is sensitive to measurement uncertainties if both wavelengths are in the Rayleigh-Jeans tail of the dust emission. Here we present only the temperature map based on the PACS 70/160 μm ratio image. On the one hand, using the PACS 70 μm image assures that we get the best temperature determination since this wavelength is shortward of the peak of the dust spectral energy distribution (SED) implying that the flux is sensitive to the dust temperature. On the other hand, using the PACS 160 μm image assures that we get the best possible resolution in the temperature map since we need to convolve the images to the resolution of the longest wavelength image prior to taking the ratio. For PACS 160 μm the resulting FWHM is approximately 12.0 × 10.5 arcsec, while for SPIRE 250 μm this would already have been reduced to 18.3 × 17.0 arcsec. The images were not corrected for line emission contributing to the inband flux as this cannot be done reliably. The result is that the grain temperature will be slightly underestimated, by about 1 K. See Sect. 4.4 for a further discussion of the line contribution.
Far-infrared continuum fluxes measured by various satellite missions.
In the PACS 70 μm data we can resolve the clumpy structure of the torus. Because of the unprecedented high resolution of the PACS 70 μm image we can compare it in Fig. 6 to the Ha+[N II] band at 6600 Å obtained from the IAC Morphological Catalog of Northern Galactic Planetary Nebulae (Manchado et al. 1996). We see that the images agree well; the brightest clumps of emission coincide in both images. Bright Hα emission and holes are visible at the edges in the northern lobe towards the southwest and in the southern lobe towards the northeast. These edges and holes are not discernable as such in the PACS images where there is just faint dust emission across these regions. We do not see the fainter clumps. In the PACS 160 μm image we confirm that there is dust emission in these regions and all across the inner lobes. Likewise, the outer lobes and even the fainter bow-like structure at the tips of the outer lobes are not detected. We do not notice that the dust emission is more extended than the Hα emission as was suggested by Ueta (2006). This is most likely a beam effect.
The infrared emission also correlates with the continuum subtracted H2 image in Marquez-Lugo et al. (2013). The H2 emission comes from the knots and filaments in the torus and some knots in the two densest regions in the inner lobes. Similarly, in NGC 6720 we also detect strong H2 emission from regions with strong dust emission, indicating that the dust and H2 are correlated.
The temperature maps of NGC 650 are presented in Figs. 7 and 8. In the temperature maps we see that the highest temperatures are observed at the position of the central star and towards the brightest regions in the lobes. The temperature seems a bit higher to the south. The temperature decreases towards the outer torus. We clearly see the effect of the absorption of direct starlight on the temperature of the dust that implies the dust is hotter in the low-opacity regions close to the central star and gets cooler as the extinction increases outward through the torus. This is discussed in Sect. 4.6.
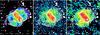 |
Fig. 6 Left: Hα image from the IAC Catalog of Northern Galactic PNe (Manchado et al. 1996). The contours of the Hα image are overlaid on the PACS 70 and 160 μm images (middle and right panel, respectively). All images are displayed on a logarithmic scale to reveal the extent of the low-level emission. |
3. Cloudy modeling
To interpret the imaging data we first created a photoionization model of NGC 650. We modeled the nebula using the photoionization code Cloudy version C10.01, last described by Ferland et al. (1998). To determine the stellar and nebular parameters, we used a method that was first described in van Hoof & Van de Steene (1999). Here we give a brief outline of the method.
The model for the PN is quite simple, and comprises the following assumptions:
- 1.
The SED of the central star is modeled using H-Ca PN model atmospheres from Rauch (1997) for solar abundances.
- 2.
The nebula has a toroidal geometry. In Cloudy this is approximated as a hollow sphere with the caps removed (this is the cylinder option in Cloudy).
- 3.
The density is constant inside the ionized region.
- 4.
Dust grains are intermixed with the gas at a constant dust-to-gas ratio. They are assumed to be single-sized and composed of graphite. The use of graphite is justified by our finding that the C/O ratio is larger than 1 (see Sect. 4.3).
- 5.
The filling factor that describes the small-scale clumpiness of the gas is unity.
The above assumptions leave the following free parameters: the stellar temperature, the luminosity of the central star, the hydrogen density in the ionized region, the inner radius of the nebula, the dust to gas mass ratio, and the nebular abundances. The outer radius of the nebula is not fixed as an input parameter. Instead the model is stopped when the observed flux density at 350 μm is reached.
Adopting certain values for the input parameters, it is possible to calculate a model for the nebula with Cloudy, predicting the continuum and line fluxes as well as the Strömgren radius. To compare the model predictions with the observed quantities, a non-standard goodness-of-fit estimator χ2 is calculated. This estimator is minimized by varying all the input parameters of the model, using the parallel algorithm Phymir which was specifically designed for this task and is integrated in Cloudy.
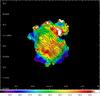 |
Fig. 7 Temperature map of NGC 650 created from the PACS 70/160 μm ratio image. The black contours are taken from the PACS 160 μm image. The blue cross marks the location of the central star. The bar at the bottom shows the temperature scale. |
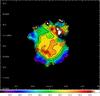 |
Fig. 8 Same as Fig. 7, but showing contours for the grain temperature. Contour levels are from 27.5 to 35.5 K with 1 K increments. |
It is assumed that there exists a unique set of input parameters for which the resulting model predictions give the best fit to a given set of observables. These input parameters are then considered the best estimate for the physical properties of the PN.
The full set of observed quantities necessary to derive the physical parameters of the PN are discussed below.
-
1.
We need an emission line spectrum of the nebula, rang-ing from the UV to the IR. The line ratios make it possible toconstrain the stellar temperature, the density and the elec-tron temperature in the nebula. They are also required to de-termine the abundances. For elements for which no linesare available we assume standard abundances (Aller &Czyzak 1983; Khromov 1989).
-
2.
Since dust is included in the model we also need information on the mid- and far-infrared continuum. For this various far-IR fluxes are used.
-
3.
To constrain the emission measure, we use an optically thin radio continuum measurement at two different frequencies.
-
4.
The angular diameter of the nebula is needed, which we define as Θd = 2rstr/D. Here rstr stands for the Strömgren radius of the nebula and D is the distance to the nebula.
The specific data used to constrain the model of NGC 650 are described in more detail in the following sections.
A more in-depth discussion of this method (including a description of how χ2 is calculated) can be found in Chapter 2 of van Hoof (1997)1.
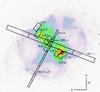 |
Fig. 9 Various apertures shown on top of the Hα image taken with the Nordic Optical Telescope (credit: Lars Ø. Andersen, Lars Malmgren, Frank R. Larsen). |
3.1. IUE data
Many large-aperture International Ultraviolet Explorer (IUE) spectra of NGC 650 exist, covering the short and long wavelength spectral range. The spectra sample various positions along the central bar as well as one of the lobes of the PN. We decided to use all spectra that were pointed at the bar and calculate a weighted average of them to approximate a long-slit spectrum over the central bar. The observations that we used are summarized in Table 2, the aperture positions are shown in Fig. 9. We used the standard pipeline reductions from the MAST IUE database and analyzed them using the Starlink SPLAT-VO tool version 3.9-6. First, we averaged the spectra, giving the spectra at positions 2 through 5 a weight of 2 and the spectra at positions 1 and 6 a weight of 1. This was done to approximately compensate for the missing flux between positions 2 and 3, as well as 4 and 5. The resulting spectra are shown in Fig. 10. We measured the line fluxes in the averaged spectrum; they are shown in Table 3. All lines except the four brightest ones should be considered uncertain. They are only marginal detections and the uncertainties returned by SPLAT-VO are probably too optimistic. We could not confirm the presence of the C ii 1336 Å and O iv] 1404 Å lines reported by Kwitter & Henry (1996).
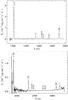 |
Fig. 10 IUE spectra of NGC 650. Top panel: SWP (short wavelength prime camera) spectrum. Bottom panel: LWP (long wavelength prime camera) spectrum. |
To calculate the ratio of the line fluxes to F(Hβ), we calculated the average Hβ flux covered by each of the IUE apertures using the Hβ image of NGC 650 (Ramos-Larios et al. 2008) and using the same weighting discussed above. After astrometrically calibrating the image and subtracting the background emission and the field stars, we determined that the average IUE slit covers a fraction 0.0361 of the total Hβ flux. We created a custom-built IDL routine for this purpose. The total observed Hβ flux of the PN is log F(Hβ) = −13.68 W m-2 (Kaler 1978). So the Hβ flux “covered” by the average IUE aperture is 7.54 × 10⁻¹⁶ W m-2. We note that this flux is a factor of two higher than the one assumed by Kwitter & Henry (1996). They used the IUE6 aperture, which partially covers the region with the highest Hβ surface brightness. Using the Hβ image we checked that the Hβ flux covered by the IUE6 aperture alone is very close to the average Hβ flux quoted above (within 2%). Kwitter & Henry (1996) used the Hβ flux from an optical spectrum observed by Peimbert & Torres-Peimbert (1987) which was taken very close to the IUE6 aperture. However, apparently they did not correct for the fact that the optical aperture was much smaller than the IUE aperture (47 arcsec2 vs. 200 arcsec2). This choice implies that the IUE line ratios and hence also the abundances based on the IUE lines reported by Kwitter & Henry (1996) are too large. In particular this is the case for the carbon abundance and the C/O ratio since the oxygen abundance is largely based on optical lines. The dereddening is discussed in Sect. 3.5.
3.2. Optical data
Obtaining optical spectra of NGC 650 that we can use in our modeling is quite difficult. We are not aware of any spectra covering a sizeable fraction of the bar, or even a long-slit spectrum along the bar. We could only find spectra covering small areas of the nebula, almost like a pencil beam. This is not ideal given that there is pronounced ionization stratification in the nebula and the spectra will not measure what we predict in our Cloudy modeling, which is the integrated flux from the entire nebula. We decided to use the optical spectra from Kwitter et al. (2003). They obtained two spectra which we call OPT-A and OPT-B. The position of the slits are shown in Fig. 9. Kwitter et al. (2003) used only the central 16′′ from the slit, so only that part of the slit is shown. OPT-A was taken near the central star and is clearly biased towards higher ionization stages in the nebula. OPT-B was taken on the bright area in the SW of the bar. This spectrum is clearly biased towards lower ionization stages in the nebula. So neither spectrum can be compared to the Cloudy model as such. We attempted to use the sum of both apertures, but this procedure also gave unsatisfactory results as the flux in the OPT-B aperture is much higher and the summed spectrum is still clearly biased towards lower ionization stages. Using preliminary Cloudy runs we noticed that the predicted flux ratio for the He ii 4686 Å line was nearly constant with a value very close to the observed ratio in OPT-A. This is because this ratio is set by the central star temperature (more precisely by the number of He2+ ionizing photons emitted by the central star) which is well constrained by the observed spectrum. A close match between the observed and modeled He ii 4686 Å line is very important since this line couples the optical and IUE spectra. This is discussed in more detail in Sect. 3.5. On the other hand, we noted that low excitation lines (e.g., [O ii] 3727 Å) were consistently predicted as very strong with model fluxes close to, or often even exceeding the observed ratio in the OPT-B spectrum. Based on these observations we adopted the following ad hoc procedure. We dereddened each of the spectra using the procedure described in Sect. 3.5. For each line we then chose the maximum value for the dereddened relative flux from each of the spectra. This procedure avoids a bias towards either high- or low-excitation areas in the nebula. The resulting line fluxes are listed in Table 4.
3.3. Spitzer data
For the far-IR fine-structure lines we used the unpublished low-resolution Spitzer IRS spectra 25 691 392 obtained in staring mode on 2009 Mar. 08. The Spitzer Space Telescope is described in Werner et al. (2004). The IRS instrument is described in Houck et al. (2004). The spectra were reduced using the SMART (spectroscopic modeling analysis and reduction tool) package v8.2.5 (Higdon et al. 2004; Lebouteiller et al. 2010). We used standard reduction steps for the data preparation: the individual files were combined into 3-plane data, the data were cleaned using IRSCLEAN with standard settings, and finally the data for each nod were co-added. For the low-resolution spectrum we subtracted the SL1 from the SL2 data (and vice versa) for each nod to do the low-level rogue pixel removal (also known as subtraction by order). We used the same procedure for the LL1 and LL2 data. Subtraction by nod could not be used since the slit is mostly or completely filled by the source. Such a procedure would lead to significant cancellation of the line fluxes. In the case of the SL spectra using subtraction by order will also lead to a slight cancellation effect since the off-target slit will also pick up some flux from the faint lobes (see Fig. 9). We estimate that the resulting error in the flux should not exceed 10−20% of the reported flux. For the LL spectra this is not an issue since there the off-target slit is completely off target. We extracted the spectra using the “full aperture (extended source)” mode. Finally we merged the two nods by calculating the mean. The resulting spectra are shown in Fig. 11. The emission lines were identified using the Atomic Line List2. The blended [S i] and [O iv] lines were measured using multi-component Gaussian fits in SMART. The measured line fluxes are given in Table 5.
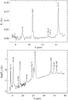 |
Fig. 11 Spitzer IRS spectra of NGC 650. Top panel: SL1 spectrum. Bottom panel: combined LL1 and LL2 spectra. The broad feature underneath the [Ne v] 14.3 μm line in the SL1 spectrum is an artifact of the detector, the so-called teardrop. The LL spectra are shown on a logarithmic scale to emphasize the continuum emission. |
To calculate the ratio of the line fluxes to F(Hβ), we calculated the Hβ flux covered by the SL and LL apertures using the same procedure outlined in Sect. 3.1. The SL slit covers a fraction 0.0242 of the total Hβ flux averaged over the two nod positions. For the LL slit this fraction is 0.186. This implies that the Hβ flux corresponding to the IRS slits is 5.06 × 10⁻¹⁶ W m-2 for the average SL slit and 3.89 × 10⁻¹⁵ W m-2 for the average LL slit.
3.4. Other data
To constrain the free-free emission from the ionized gas, we used a 4.85 GHz measurement of 114 ± 10 mJy from the GB6 catalog (Gregory et al. 1996), as well as a 1.4 GHz measurement of 141 ± 5 mJy from the NRAO VLA Sky Survey (Condon & Kaplan 1998). To constrain the dust emission, we used broadband fluxes from the IRAS point source catalog v2.0 at 60 and 100 μm (IPAC 1986), from Spitzer MIPS images at 70 and 160 μm (Ueta 2006), and from the PACS and SPIRE images presented in this paper at all five wavelengths. The data are summarized in Table 1. Since the source is extended, the appropriate correction for extended source calibration was applied to the SPIRE fluxes; ![Mathematical equation: \begin{equation} F_\nu{\rm [actual]} = \frac{K_{\rm 4E}}{K_{\rm 4P}}\frac{F_\nu{\rm [quoted]}}{K_{\rm color}}\cdot \end{equation}](/articles/aa/full_html/2013/12/aa21023-12/aa21023-12-eq46.png) (1)The correction factors are given in Table 1. We note that the definition of Kcolor is the inverse of the definition used in the SPIRE Observer’s Manual, but agrees with the definition used by the other instrument teams. We fitted a modified blackbody to the data, given by
(1)The correction factors are given in Table 1. We note that the definition of Kcolor is the inverse of the definition used in the SPIRE Observer’s Manual, but agrees with the definition used by the other instrument teams. We fitted a modified blackbody to the data, given by
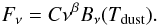 The resulting parameters were Tdust = 29.9 ± 1.1 K and β = 2.12 ± 0.12. The value for β is within the uncertainty equal to the theoretically expected value β = 2 for optically thin dust. The color corrections were based on this model. The actual fluxes and the best-fit model are shown in Fig. 12.
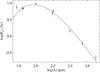 |
Fig. 12 SED of the dust in NGC 650. The solid line shows the modified blackbody that was fitted to the observations. |
The diameter of the bar-like region is 100 arcsec which we used to constrain the diameter of the ionized region. For the height of the torus we assumed 0.193 pc. If viewed exactly edge-on, this would equate to 33′′ at the assumed distance of NGC 650.
3.5. Dereddening the spectra
Before we could model NGC 650, we needed to correct the observed line ratios for the effects of interstellar and circumstellar reddening. First we determined the extinction coefficient c(Hβ) averaged over the nebula. We did this by comparing the Hβ flux derived from the optically thin 4.85 GHz radio flux to the observed Hβ flux. To calculate the predicted Hβ flux, we used the equation ![Mathematical equation: \begin{equation} \frac{S_\nu}{F({\rm H}\beta)} = 2.51\times10^{10} \ T_{\rm e}^{0.53} \nu_9^{-0.1} \, Y \hspace{2mm} \left[ \frac{\rm Jy}{\rm W\,m^{-2}} \right], \end{equation}](/articles/aa/full_html/2013/12/aa21023-12/aa21023-12-eq52.png) (2)taken from Pottasch (1984). In this formula, Sν is the observed radio flux in Jy, Te the electron temperature averaged over the ionized region, ν9 the frequency of the radio observation in GHz, and Y is given by
(2)taken from Pottasch (1984). In this formula, Sν is the observed radio flux in Jy, Te the electron temperature averaged over the ionized region, ν9 the frequency of the radio observation in GHz, and Y is given by 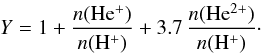 (3)Using the data from a preliminary Cloudy model of NGC 650, we found that Y = 1.214 and the average Te = 11.8 kK. Using these values yielded a predicted value log F(Hβ) = −13.52 W m-2. When compared to the observed value log F(Hβ) = −13.68 W m-2 (Kaler 1978) this yielded c(Hβ) = 0.16 ± 0.04 dex. Using the same procedure on the observed 1.4 GHz flux yielded c(Hβ) = 0.20 ± 0.03 dex. Both values are in agreement within the uncertainty. We adopted the average of the values: c(Hβ) = 0.18 ± 0.03 dex.
Various determinations of the extinction derived from optical spectra using the Balmer decrement method can be found in the literature. Peimbert & Torres-Peimbert (1987) report c(Hβ) = 0.35 dex in a spectrum centered on the high surface brightness region in the southwest of the bar. Kwitter et al. (2003) report c(Hβ) = 0.08 dex in the NGC 650A spectrum, centered on a low-density region close to the central star, and c(Hβ) = 0.21 dex in the NGC 650B spectrum, also centered on the high surface brightness region in the southwest of the bar. These data indicate that the extinction varies over the nebula. This is confirmed by the analysis of Ramos-Larios et al. (2008) who conclude that there are appreciable levels of clumping within the central bar. They also report a gradual increase in extinction along the major axis of the bar towards the northeast. They conclude that probably much of the dust responsible for the extinction is located within the nebula itself, i.e., that the nebula has an appreciable amount of internal extinction. This is remarkable for a highly evolved nebula like NGC 650.
To deredden the UV data, we also needed to consider the shape of the extinction curve, usually parameterized by the ratio of absolute to selective extinction RV. It is well known that this parameter differs substantially for different sight lines through the interstellar medium (ISM; e.g., Fig. 2 of Fitzpatrick 1999) with values ranging between RV = 2.2 and 5.8. If the nebula has an appreciable amount of internal extinction, this may result in an extinction curve that is unlike a normal ISM extinction curve. We assumed that we could use the parameterized extinction curve given by Fitzpatrick (1999). To do the dereddening, we demanded that the dereddened line ratio of He ii λ1640/λ4686 equals the theoretical value of 6.35. Doing this while keeping RV at the standard value of 3.1 yielded c(Hβ) = 0.604 dex, which implies AV = 1.27 mag. Inspecting Fig. 5 of Ramos-Larios et al. (2008) showed that this value is not found anywhere in the bar, clearly excluding this value for RV. Hence we were forced to treat RV as a free parameter. To determine the value of RV, we combined the criterion above with the requirement that the extinction equals AV = 0.7 mag, an average of the data in Fig. 5 of Ramos-Larios et al. (2008) over the various IUE apertures. This yielded RV = 2.35 and c(Hβ) = 0.346 dex. Such a low value for RV is indicative of dust with a large amount of carbonaceous material and/or a smaller than usual grain size distribution (e.g., due to the presence of PAHs). This would be consistent with the presumed presence of very small carbonaceous grains (possibly PAHs) in the clumps, in addition to the larger grains. See Sect. 4.6 for further discussion. The fact that we found a higher c(Hβ) than with the radio method is consistent with the fact that there is internal extinction in the bar.
Given that the extinction in NGC 650 is very patchy and the optical spectra cover only a small fraction of the bar, we used the Balmer decrement method and derived a separate value of c(Hβ) for each of the optical spectra. Using RV = 2.35 and requiring that the dereddened flux ratio F(Hα)/F(Hβ) be equal to the theoretical ratio 287 we found c(Hβ) = 0.065 dex for the OPT-A spectrum and c(Hβ) = 0.173 dex for the OPT-B spectrum.
Given that the IRS apertures cover a large area of the bar region (at least the LL aperture does) we dereddened the IRS spectra using the same extinction parameters as the IUE data.
3.6. Modeling results
Since the nebula is reported to be carbon-rich (Kwitter & Henry 1996), we assumed graphite dust to be present in the nebula. Early modeling results indicated that assuming the default Orion grain size distribution in Cloudy (which is an approximation for RV = 5.5 material) yields a higher grain temperature than the observations allow, no matter how we varied the geometry. We therefore assumed that the grains in NGC 650 are large and we approximated them with single-sized grains with the radius as a free parameter. The best fit with the observed SED was obtained by using grains with a radius of 0.15 μm. Single-sized grains are not realistic for NGC 650, but apart from the observed SED we have no additional information to constrain the size distribution. So instead of introducing poorly constrained additional free parameters in the size distribution, we decided to adopt a single-size approximation. The Cloudy model yielded an average grain temperature of 31.5 K, in good agreement with the observations. We assumed a constant density in the nebula and used the 350 μm flux as a stopping criterion for the model. The resulting model is shown in Table 6. It will be discussed in detail in Sect. 4. Our model is simultaneously ionization and density bounded because the hydrogen ionization fraction is almost exactly 50% at the outer edge. This implies that the Cloudy model does not predict the presence of a PDR and therefore also does not predict any molecular emission. This is not in agreement with observations as NGC 650 has been detected in H2 (Zuckerman & Gatley 1988; Kastner et al. 1996; Marquez-Lugo et al. 2013) but not CO (Huggins & Healy 1989; Huggins et al. 1996). This will be discussed further in Sect. 4.7.
The fact that we find larger than normal grains in the ionized region seems contradictory with our findings in Sect. 3.5 where we mention the presence of very small grains in the dense molecular knots. However, we point out that very small grains (PAHs) can only survive in the dense knots where they are shielded from the ionizing radiation. Including them in our modeling would have been inappropriate since we only model the ionized gas. Furthermore, the very small grains are expected to have a much smaller total mass than the large grains, making their emission unimportant at wavelengths ≥60 μm. This is discussed further in Sect. 4.6.
Parameters of the Cloudy model of NGC 650.
4. Discussion
In this section we give a detailed discussion of the central star of NGC 650 and the physical properties of the nebula (with emphasis on the dust grains) using the Cloudy model that we derived in Sect. 3. The model input parameters, as well as a few derived quantities and the overall χ2 of the fit, are presented in Table 6.
4.1. The central star temperature
With a temperature of 208 kK, the central star is clearly of a very high excitation class. The low luminosity of 261 L⊙ indicates that the star is already well evolved on the cooling track and that all internal nuclear reactions have ceased. Comparing these numbers to the evolutionary tracks calculated by Blöcker (1995) yield the best fit to the track with a zero-age main sequence (ZAMS) mass of 7 M⊙ (core mass 0.940 M⊙). The age of the PN implied by the model track is roughly 9000 yr. When we combine the expansion velocities given by Bryce et al. (1996) (60 km s-1 for the inner lobes) with the angular diameter (170′′) and distance (1200 pc), we find a kinematical age of 8000 yr, in excellent agreement with the model track. However, we also need to consider the uncertainties in this determination. Central stars with a ZAMS mass of 7 M⊙ are expected to undergo hot-bottom burning on the AGB which efficiently converts carbon into nitrogen, thus preventing the stars from becoming carbon-rich. However, this process decreases in efficiency when the envelope mass is reduced, thus opening up the possibility for more massive stars to become carbon-rich towards the end of the thermally-pulsing AGB phase (Frost et al. 1998; Herwig 2005). A further consideration is that hydrogen-deficient tracks yield higher temperatures than hydrogen-rich ones for the same core mass (Werner & Herwig 2006, and references therein). This is a concern because we used a hydrogen-rich track while we know that the central star is hydrogen-deficient. Unfortunately, only a few calculations exist for hydrogen-deficient central stars and none of them model sufficiently massive central stars for our needs. All we can say is that the Vassiliadis & Wood (1994) hydrogen-deficient tracks indicate a ZAMS mass larger than 2 M⊙. We should also take the uncertainties in stellar evolution modeling into account. See Herwig (2008) for a review of the uncertainties involved in modeling the AGB phase.
Other possible sources of uncertainty are the determination of the distance and/or the stellar temperature. The uncertainty in the distance determination is difficult to assess, but is likely substantial (see Sect. 1). There are also concerns regarding the central star temperature. We see that the stellar temperature we derived from nebular modeling is considerably higher than the value of 140 kK derived from the observed stellar spectrum (Napiwotzki & Schönberner 1995). The stellar temperature seems quite well constrained given that we see many different ionization stages in the spectra. However, the highest ionization stages are not observed, most notably Ne5+ and Ar5+. The [Ar vi] 4.53 μm over [Ar v] 13.1 μm line flux ratio, and more importantly the [Ne vi] 7.65 μm over [Ne v] 14.3 μm ratio, would have been strong constraints for the stellar temperature. Unfortunately, the [Ar vi] 4.53 μm line is outside the IRS wavelength range and the [Ne vi] 7.65 μm line has not been detected due to the faintness of the line (we note however that the non-detection is consistent with our model).
We investigated the accuracy of our temperature determination by creating additional fixed-temperature models with the stellar temperature and the inner radius fixed while optimizing all remaining parameters. The stellar temperature was fixed at values between − 0.1 and + 0.1 dex from the optimal value of 208 kK. The inner radius was kept fixed at 93 mpc since that value agrees well with the observed morphology. This is necessary since otherwise the code would alter the inner radius in an attempt to keep the ionization parameter constant and thus counteract the effect of changing the stellar temperature. We searched for stellar temperatures such that the χ2 would be 1 higher than the optimal value. This procedure gives us an estimate of the 1σ uncertainty of the stellar temperature. The result is  kK. We found that the most important temperature sensitive ratio is the [Ne v] 14.3 μm over [Ne iii] 15.6 μm ratio, which is well constrained by the LL2 spectrum. We also checked that an alternative Cloudy model with the central star temperature fixed to 140 kK can be ruled out at the 7σ level (keeping the inner radius fixed as discussed above). The alternative model predicted a line flux ratio of 0.0265 compared to the observed value of 0.232 and 0.207 predicted by the optimal Cloudy model. Using this procedure we derived a 3σ lower limit for the temperature of 165 kK.
One possibility we need to consider is that the nebular material is not in photoionization equilibrium with the central star. This could be the case because the central star is cooling down and also dropping in luminosity which will cause the nebular gas to recombine. This process will take a finite time, implying that the nebula will reflect the higher temperature and luminosity of the central star at an earlier time. To derive a timescale for the reaction of the gas we will look only at the recombination of a highly ionized ion. In particular we will use Ne4+ since that is the most highly ionized ion that was detected and spectral lines from this ion are crucial for constraining the stellar temperature. For gas with the parameters given in Table 6 the total recombination coefficient is 3.15 × 10⁻¹¹ cm3 s-1, which then yields a recombination timescale of 6.8 yr. Similarly we find 8.4 yr for Ar4+ and 13.8 yr for O3+. These timescales are much shorter than the evolutionary timescale so that we can safely assume that at least the most highly ionized ions are effectively in equilibrium with the central star. We therefore feel confident that a stellar temperature of 140 kK is ruled out by the Cloudy modeling.
As we already remarked in Sect. 1, the central star spectrum used by Napiwotzki & Schönberner (1995) to derive the central star parameters seems to have rather low signal-to-noise ratio. This could cast doubt on their observation that the spectrum is very similar to the spectrum of PG 1159, which has been well studied (Werner et al. 1991). Furthermore, the optical spectrum of PG 1159 shows highly excited lines of C iv, N v, O vi, and He ii. The CNO lines will be crucial for determining the central star temperature. The 140 kK model atmosphere shows that CNO is nearly fully in its helium-like state throughout the atmosphere (see Fig. 4 of Werner et al. 1991). Raising the stellar temperature by moderate amounts would not change this as an enormous amount of energy is needed to ionize CNO into its hydrogen-like state (viz. 392 eV for H-like carbon, compared to 138 eV for He-like oxygen). This could suggest that the optical spectrum becomes insensitive to temperature changes above 140 kK. We will not, however, investigate this conjecture any further as it is well outside the realm of this paper.
We could try to verify the stellar temperature by comparing the predicted absolute V-band magnitude MV = 7.64 mag from the stellar atmosphere model with the observed dereddened V-band magnitude mV = 17.00 mag from Koornneef & Pottasch (1998). This requires knowledge of the distance of the star. Unfortunately, we cannot use the gravity distance of 1200 pc from Koornneef & Pottasch (1998) for this purpose as this is based on an assumed temperature of the central star. Doing so would invert their analysis and by definition yield the assumed value of 140 kK. So we are not able to carry out this analysis until an accurate distance based on an independent method becomes available.
An additional constraint for the stellar temperature could be obtained from the upper limit of the X-ray flux determined with Chandra (Kastner et al. 2012). We used the absolutely calibrated central star spectra from our additional fixed-temperature models that we described above and predicted the Chandra count rate for each of those. Using this procedure we could determine a 3σ upper limit for the central star temperature of 178 kK. In this calculation we included the effects of internal extinction in the nebula (AV = 0.1 mag) but not interstellar extinction. The total extinction towards the central star is unknown. The extinction measured in the OPT-A spectrum is AV = 0.13 mag. If we assume this value for the central star as well, this would raise the 3σ upper limit for the central star temperature to 183 kK. A total extinction of AV = 0.2 mag towards the central star would raise the upper limit to 193 kK. In our photoionization modeling, such a temperature would be allowed at the 1σ level. It should be noted however that such a central star has a very soft spectrum, with most of the photons in the 0.2−0.3 keV range. In this range the calibration of Chandra is quite uncertain.
All in all we find that there are many uncertainties making a comparison with theoretical tracks difficult, but we are confident that the progenitor of the central star had a mass of at least 3 M⊙. This lower limit is based on the kinematical age of the nebula and the nebular abundance pattern (see Sect. 4.3) both of which should be relatively robust determinations.
4.2. The AGB shell
No spherical halo has ever been observed beyond the lobes of NGC 650 and we also do not detect a spherical dusty AGB halo, as has been the case for NGC 6720, for example. The nebula NGC 650 has a PG 1159 central star. The origin of the PG 1159 stars can possibly be explained by a very late thermal pulse initiating the born-again post-AGB scenario (Althaus et al. 2008). If so, the PG 1159 stars would go through the post-AGB evolution up to three times (Schönberner 1979; Iben et al. 1983; Hajduk et al. 2005; van Hoof et al. 2007). Given the unusually high expansion velocity of the nebula, it is possible that the ejecta from the second post-AGB loop have now overtaken the original PN.
4.3. Elemental abundances
Our modeling confirms that the gas in NGC 650 is carbon rich, with C/O = 2.1. This is lower than the value 2.96 ± 0.50 derived by Kwitter & Henry (1996) which is based solely on the C iii] λ1909 line, while we include the C ii] λ2326 and C iv λ1549 lines as well. The main reason for the discrepancy is the assumed Hβ flux corresponding to the IUE aperture, as was already discussed in Sect. 3.1. The Hβ flux we assume is about a factor of 2 higher, which lowers the strength of the carbon lines by the same amount. Other factors that contribute to the change in the C/O ratio are the fact that we average the flux over six apertures (this raises the C iii] λ1909 flux by some 10%) but more importantly that we do the dereddening using an RV = 2.35 law (this raises the dereddened C iii] λ1909 flux by nearly 20%). The fact that the gas is carbon rich justifies our choice to use carbonaceous grains.
The abundances are typical for a type IIa PN (Maciel 2000) with He/H = 0.11 and log (N/O) = −0.42, using the classification scheme of Faúndez-Abans & Maciel (1987). This would make the progenitor star a fairly massive galactic disk object. This is consistent with the high stellar temperature that we derived.
4.4. Line contribution to the broadband fluxes
The various broadband fluxes that we presented in this paper will not only contain thermal emission from dust grains, but also various emission lines. We can use the Cloudy model to assess the line contribution in each of the photometric bands. We do this by taking the absolutely calibrated model spectrum (shown in Fig. 13) and fold this with the various passbands to obtain synthetic photometry. This model spectrum contains continuum and line emission, but these two components can be separated allowing us to get detailed information about the line contribution in each passband. We did not include the incident spectrum in the model as this includes the cosmic microwave background (CMB) emission. This component would raise the SPIRE 500 μm flux noticeably and would be inconsistent with observations since the CMB emission was removed in the background subtraction procedure (it is uniform over the image). For passbands at shorter wavelengths the omission of the central star spectrum has no effect since we checked that it is negligible in all the bands we consider. In Table 7 we present the synthetic fluxes we obtained combined with all emission lines contributing more than 3% of the inband flux. We note that the Cloudy model does not model the high-density clumps where the H2 resides (see Sect. 4.7). Hence the H2 lines are not included in the synthetic photometry. We expect that this has little impact on the predictions as these lines are weak in this PN (see Sect. 4.7).
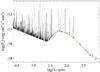 |
Fig. 13 Infrared spectrum computed by Cloudy. The far-IR photometry from Table 1 (shown as red diamonds) is also included to demonstrate the quality of the fit. |
Synthetic photometry of NGC 650.
In addition to the line emission, there is also continuum emission contributing to the inband flux. The continuum emission can be characterized as follows. In the short wavelength bands (λ < 12 μm) nebular free-free and free-bound emission will contribute to the inband flux, while the dust emission is negligible. At longer wavelengths the dust continuum will be the dominant continuum contribution. It peaks around 80 μm and then starts to drop again. Around 500 μm nebular free-free emission will become noticeable again and longward of 1 mm, free-free emission will be the dominant continuum source. Hence there is a small contribution of free-free emission to the red wing of the SPIRE 500 band. This explains why this point is slightly above the SED fit in Fig. 12. In the mid-IR range (12 to 25 μm) the continuum is predicted to be weak so that the inband flux is almost completely dominated by line emission. This could make synthetic photometry less accurate if narrow features exist in the passband (e.g., because of incomplete understanding of the transmission function or Doppler shifts in the lines).
Comparing the synthetic IRAC (infrared array camera) fluxes with the observed values (3.6 μm: 0.0359 Jy, 4.5 μm: 0.0708 Jy, 5.7 μm: 0.0359 Jy, 7.9 μm: 0.1067 Jy; Hora et al. 2004) shows that they are in excellent agreement, with the 5.7 μm band showing the largest discrepancy (around 25%). The other three bands all agree within 10%. We note that the IRAC fluxes were not used to constrain the Cloudy model, so these present an independent validation of the model. The long wavelength photometry (λ > 60 μm) is also in good agreement with observations, even though the Cloudy model systematically slightly over-predicts the fluxes. This is because the observed fluxes in this wavelength range were used to constrain the dust continuum in the Cloudy model, but were not corrected for line emission. As a result the dust-to-gas mass ratio will be somewhat too large. We estimate this error to be around 10%. The IRAS 25 and MIPS 23.7 μm synthetic fluxes show the biggest discrepancy with observations (2.79 and 4.51 Jy, respectively, Ueta 2006). This will be discussed further in Sect. 4.6.
4.5. Properties of the dust grains
Using the Cloudy model, we derived that the mass of the central bar is 0.23 M⊙ (but we note that our model does not explicitly model the high-density clumps in the bar; it assumes constant density). Using the dust-to-gas mass ratio Γ = 6.0 × 10⁻³ that resulted from the Cloudy model, we find that the dust mass in the bar of NGC 650 is 1.4 × 10⁻³M⊙. The main uncertainty in this number will come from the uncertainty in the distance determination.
In Sect. 3.6 we find that the dust grains in the ionized region of NGC 650 are larger than typical grains in the ISM. This has been seen in other PNe as well, NGC 6445 (van Hoof et al. 2000) for example. Several explanations could be proposed for this observation. The first explanation is that the smallest grains have been destroyed in the circumstellar environment, either through shocks or more gradual processes like thermal sputtering in the ionized region. This explanation seems unlikely as grain destruction would return fourth-row elements like calcium and iron to the gas phase. These elements have very prominent emission lines in the optical region if they are at solar abundance. These lines are not seen in the optical spectrum. This is also confirmed by the analysis of Stasińska & Szczerba (1999) who find that there is a considerable spread in the dust content of planetary nebulae, but that there is no evidence for a decrease in the dust-to-gas mass ratio as the planetary nebulae evolve. They conclude that the results suggest that the timescale for destruction of dust grains in planetary nebulae is larger than their lifetime.
The second explanation could be that the grains have been processed in the circumstellar environment. Since the density in a typical planetary nebula is too low for such processes, this would require the presence of a circumstellar disk. This process is known to be at work in some evolved objects such as the Red Rectangle (Jura et al. 1997), M1–92 (Murakawa et al. 2010), and other post-AGB objects (Gielen et al. 2011). However, currently there is no evidence for the presence of such a disk in NGC 650. It is also not clear how the grains would be transported from the circumstellar disk to the torus, or if the circumstellar disk could have evolved into the torus.
The third explanation could be that the large grains formed during the AGB stage. The evidence for this is currently mounting, both for oxygen-rich AGB stars (Norris et al. 2012; Groenewegen 2012) and carbon stars (Menut et al. 2007). It has also been seen in post-AGB objects (e.g., Ueta et al. 2001). This seems the most plausible explanation and would imply that planetary nebulae inject mostly larger-than-average grains into the ISM.
 |
Fig. 14 Various components contributing to the grain heating as a function of radius from the central star. |
4.6. Grain heating
The temperature maps of NGC 650 are presented in Figs. 7 and 8. In the temperature map of Fig. 8 it is clear that the hottest dust grains (shown by the contours at 31.5 K and higher) are only present in the low-density area along the polar axis of the torus. The lower temperature contours (30.5 K and lower) on the other hand, are more or less spherical and are centered on the central star. The dust grains are primarily heated by UV photons, either continuum photons emitted by the central star, or diffuse emission from the gas (predominantly Lyα photons). For a discussion see van Hoof et al. (2000). The morphology of the dust temperature distribution suggests that the hottest dust grains are heated in part by a radiation component that is readily absorbed by the torus, while the radiation that is heating the cooler grains is clearly not absorbed by the torus as is evident from the spherical contours. An alternative explanation could be that the hottest grains are heated in part by shocks of a wind striking the inside of the torus. However, in view of the highly evolved status of the central star, the presence of a strong wind that would be needed to create such a shock is not expected. The fact that NGC 650 is not a source of diffuse X-ray emission (Kastner et al. 2012) also argues against the presence of a strong shock.
We can analyze the grain heating further using the Cloudy model. In Fig. 14 we show the various components contributing to the heating of the grains as a function of depth into the torus. These components are: heating by incident radiation emitted directly by the central star, collisional heating by the gas, and heating by diffuse emission from the ionized gas. The latter component is dominated by Lyα photons which contribute more than 50% of the total diffuse heating. We have therefore shown this component separately in Fig. 14 (we note that the curve labeled “diffuse” already includes the Lyα heating). This figure shows that at the inner face incident starlight is an important heating source. At greater depth the heating is quickly taken over by diffuse photons and this remains true all the way up to the outer edge of the model. At this point two shortcomings of the Cloudy model must be pointed out. The first is that Lyα photons are heavily scattered by hydrogen atoms (see also van Hoof et al. 2000). The photons make a random walk through the gas until they are finally absorbed by a grain or some other background opacity. During this random walk the photons can travel a considerable distance, which is not modeled correctly in Cloudy. This implies that the distribution of Lyα photons will be flatter than shown in Fig. 14 and especially near the inner face the Lyα density is expected to be higher than shown in the plot. Consequently the fact that the total grain heating peaks at a finite depth into the model is likely to be an artifact resulting from this deficiency.
The second shortcoming in the Cloudy model is that it assumes the gas is smooth, while in actual fact it has high-density clumps that are very efficient at absorbing the incident UV radiation. We know this because H2 molecules reside in these clumps (see Sect. 4.7). Depending on the covering factor of these clumps, this may imply that the heating by incident radiation drops off more quickly than suggested by the model. With these shortcomings in mind we can say that, at least qualitatively, the Cloudy model confirms the view that we derived from the analysis of the temperature map: inside the hole of the torus and at a shallow depth into the torus, incident radiation from the central star will contribute significantly to the heating of the grains. However, this component is quickly absorbed away, leaving only diffuse photons as a heating agent. We note that Lyα photons are produced everywhere in the ionized gas and can even be scattered into the dense clumps. This explains the smooth, near spherical component in the grain heating. We also note that Lyα photons heating the grains in the clumps is not in contradiction with the presence of H2: Lyα photons cannot destroy H2 in the ground state (e.g., Draine 2000).
Ueta (2006) presented a two-component fit to the dust emission including a hot component of 140 K. This temperature was constrained by the IRAC 7.9 μm flux measurement of 0.107 Jy (Hora et al. 2004) and the MIPS 23.7 μm flux measurement of 4.51 Jy (Ueta 2006). Looking at the synthetic photometry in Table 7 we can see that the measured IRAC flux is in excellent agreement with the Cloudy model. We therefore feel confident that no hot dust is contributing to the IRAC flux. The observed IRAS 12 μm flux, 0.28 Jy in the point source catalog (PSC) and 0.255 Jy in the faint source catalog (FSC) is slightly higher than predicted by the model. This value is close to the detection limit of IRAS, so to double check this result we also measured the flux in the WISE (wide-field infrared survey explorer) 11.6 μm image. This yielded 0.62 Jy, also higher than predicted by Cloudy. Hence hot dust could be contributing 0.1−0.2 Jy at 12 μm, but certainly not ≈1.5 Jy as was predicted by Ueta (2006). So the presence of a 140 K component with the strength suggested by Ueta (2006) can be ruled out. At longer wavelengths there is a rather large discrepancy between the observed and synthetic flux in the MIPS 23.7 and IRAS 25 μm bands. The observed values are 4.51 Jy for MIPS, 2.79 Jy for the IRAS PSC, and 3.14 Jy for the IRAS FSC. The model predicts that the inband flux should be dominated by [O iv] emission. This is consistent with the fact that the nebula is clearly narrower in the MIPS 23.7 μm band (Ueta 2006) since ionization stratification limits the [O iv] emission to the inner regions of the PN. However, the discrepancy with the observations cannot be explained by problems with the model line flux since the [O iv] flux is constrained by observations and fits very well. The big discrepancy between the observed MIPS 23.7 and IRAS 25 μm fluxes could indicate that there are problems with the data reduction (e.g., due to an imperfect background subtraction). We say this because the synthetic fluxes in these bands are nearly equal indicating that there is no known reason for the discrepancy between the observed fluxes. It is also clear that there is excess continuum emission that is not accounted for in the model (see Fig. 11). Possible candidates would be stochastically heated very small grains (possibly PAHs) and/or a separate hotter dust component.
To investigate this further we measured the flux in the WISE 22.1 μm band. This band has the advantage that the [O iv] emission contributes much less to the inband flux since the line is in the wings of the passband. This is evident because the synthetic WISE 22.1 μm flux is much lower than the synthetic IRAS 25 and MIPS 23.7 μm flux. The observed value for the WISE 22.1 μm flux is 3.92 Jy, in good agreement with the MIPS 23.7 μm flux. This indicates that the continuum dust emission that is not accounted for in the Cloudy model must be the dominant contribution to the WISE 22.1 μm flux. Ueta (2006) hinted that the hot dust component could be similar to the debris disk that was reported by Su et al. (2007) in NGC 7293. However, the WISE 22.1 μm image shown in Fig. 15 shows a similar morphology compared to the other images, only narrower, which makes this explanation unlikely. The peak of the emission clearly coincides with the inner edge of the bright region in the SW of the bar and not the central star. Since the continuum emission dominates the WISE passband, this is strong evidence against a disk since that would have produced a strong point-like peak at the location of the central star. Hence stochastically heated very small grains in the dense clumps seem more likely. These grains cannot survive in ionized gas and could therefore only exist in the dense clumps where they are shielded from the ionizing radiation. This implies that adding them to the Cloudy model would not have made any difference since the Cloudy model stops at the outer edge of the ionized region. The fact that the MIPS 23.7 μm image appears narrower than the longer wavelength images can probably be attributed to the fact that stochastic heating is less efficient in the outer reaches of the bar because of extinction effects. The fact that the peak of the WISE 22.1 μm emission is shifted towards the central star with respect to the peak in the PACS 70 μm emission is also consistent with this. The UV photons responsible for the stochastic heating emitted by the central star are readily absorbed in the torus. The presence of very small grains would also be consistent with the low RV value that we derived in Sect. 3.5. Most likely the very small grains would have a much lower mass than the large grains, implying that their emission would contribute very little in the PACS and SPIRE bands. However, further research will be needed to settle this point.
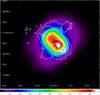 |
Fig. 15 WISE 22.1 μm image of NGC 650. The image is normalized in the standard DN units (1 DN = 5.2269 × 10⁻⁵ Jy/pixel). The contours are taken from the PACS 70 μm image. The blue cross marks the position of the central star. |
4.7. Molecules in NGC 650
Molecules are known to be present in NGC 650. Specifically, H2 has been detected (Zuckerman & Gatley 1988; Kastner et al. 1996; Marquez-Lugo et al. 2013). By inspecting Fig. 8 of Marquez-Lugo et al. (2013) it is clear that the H2 emission has a very clumpy morphology. This is very different from young massive PNe were the H2 can be found surrounding the ionized region as an unbroken layer (i.e., more like a classic PDR, see e.g., Latter et al. 2000).
Some authors (Hora et al. 2004; Ramos-Larios et al. 2008) have argued for the existence of a PDR surrounding the ionized region of NGC 650, similar to young PNe like NGC 7027. In both papers the argumentation is based on the IRAC images which they assume to contain typical PDR emission, at least to a significant level. Both authors observe that the IRAC 7.9 μm image appears more extended than the shorter wavelength images. Hora et al. (2004) assume that this band contains H2 emission while Ramos-Larios et al. (2008) assume that it contains PAH bands. We have analyzed the contributions to the IRAC bands in Sect. 4.4 and concluded that the Cloudy model gives a very good prediction for the inband flux despite the fact that it does not contain H2 or PAH emission from a PDR. This leaves little room for additional flux components. It is clear that H2 emission will be contributing at some level though, and possibly also PAH features. The H2 contribution is likely to be small, as will be discussed in more detail below. The PAH 6.2, 7.7, 8.6, and 11.2 μm features are not visible in the IRS spectra and therefore PAHs are less likely to contribute much to the IRAC 7.9 μm band. However, it is possible that the SL aperture happened to miss the dense clumps that could contain the PAHs. The fact that we assume that we see stochastically heated very small grains in the MIPS 23.7 and WISE 22.1 μm images does not necessarily imply that significant PAH emission should be present in the IRAC passbands. This depends on the highest temperature that the PAHs reach during the temperature spikes. But even if PAHs were contributing significantly, it can be clearly seen in the top panel of Fig. 1 of Ramos-Larios et al. (2008) that the IRAC 7.9 μm emission is completely embedded in the Hα emission from the ionized region, clearly ruling out a PDR surrounding the ionized region of the torus.
Therefore in this PN the H2 only resides inside dense clumps that are embedded in the ionized gas. This situation is reminiscent of other highly evolved PNe like the Helix nebula (NGC 7293) and the Ring nebula (NGC 6720). We therefore need to consider the conjecture that the same mechanism is responsible for the formation of these clumps. The fact that the central star is already well evolved on the cooling track indicates that the nebular gas is either going through a recombination phase, or has gone through this phase in the recent past. In the latter case the nebula should have started to ionize again as a result of expansion. In van Hoof et al. (2010) we proposed that the knots in NGC 6720 formed during the recombination phase due to an instability caused by rapid cooling of the gas. The fast cooling results in gas that is still ionized (and thus produces abundant recombination radiation) but has very little thermal pressure support. The radiation pressure of the recombination radiation on the dust and/or gas could then cause the medium to become unstable and fragment into many globules. The high density in the knots makes it possible to re-form H2 molecules on a suitable timescale.
The PN NGC 6781 is a bipolar nebula seen nearly pole-on that seems to have a similar morphology to NGC 650 as it also possesses high-density clumps that may be responsible for much of the molecular emission (Phillips et al. 2011). However, in this nebula the H2 emission lines detected in the IRS spectra are much stronger than in NGC 650 and the emission extends to distances up to 60′′ beyond the rim. Further research will be needed to determine whether this PN really is in a similar evolutionary state.
The IRS spectrum of NGC 650 is dominated by high-excitation atomic fine-structure lines, as is typical for a hot PN. No H2 emission lines have been detected even though the (0, 0) S(7) through (0, 0) S(0) lines are covered by the IRS wavelength range. H2 lines are typically quite weak compared to atomic fine structure lines, so this may be expected. Zuckerman & Gatley (1988) observed NGC 650 using an aperture with a diameter of 19.6 arcsec on 8 positions. They report detections of the (1, 0) S(1) line on 3 positions (near the bright region in the SW) between 7 × 10-20 and 17 × 10-20 W m-2 arcsec-2 averaged over the aperture. Using these numbers we estimate that this corresponds to a flux of roughly 10-16 W m-2 in the area covered by the LL aperture, though that number has a considerable uncertainty. No other lines of H2 have ever been measured, so the excitation of the molecule is unknown. One could assume that the (0, 0) S(5) line is the strongest in this series (Phillips et al. 2011) and comparable in strength to (1, 0) S(1). The noise in the SL2 spectrum (which covers the (0, 0) S(7) through (0, 0) S(4) lines) is 3.8 × 10⁻¹⁵ W m-2 μm-1. Using a FWHM of 0.2 μm for the line width, this is consistent with the non-detections of the H2 lines. The noise is much better in the SL1 spectrum (1.2 × 10⁻¹⁶ W m-2 μm-1), but the lower lines of the series are too weak to be detectable despite this. This makes it unlikely that the H2 lines contribute significantly to the IRAC 7.9 μm band.
The nebula NGC 650 has not been detected in CO (Huggins & Healy 1989; Huggins et al. 1996) in regions where the H2 emission is strongest, unlike NGC 7293 and NGC 6720. In PDR modeling it is well known that CO forms at greater optical depths than H2. In fact the UV shielding provided by the H2 molecules is needed to enable CO formation. This could indicate that either the optical depth of the clumps in NGC 650 is insufficient to reach the level of UV shielding needed, or that the H2 abundance is too low and these molecules provide insufficient shielding. The latter could then have been caused either by dissociation of existing molecules or because there was insufficient time to re-form the necessary amounts of H2. Additional research will be needed to investigate this.
5. Conclusions
In this paper we presented new Herschel PACS and SPIRE images of NGC 650. We used these images to derive a temperature map of the dust. We also constructed a photoionization model using the spectral synthesis code Cloudy. To constrain this model, we used the PACS and SPIRE fluxes and combined these with hitherto unpublished IUE and Spitzer IRS spectra as well as various other data from the literature. The temperature map and the photoionization model were used to study various aspects of the central star, the nebula, and in particular the dust grains in the nebula. These are the main conclusions.
-
The central star is hydrogen deficient and ofPG 1159 (E) type. The photoionization modelshows that the central star is well evolved on the cooling track. Ityields an unusually high central star temperature of
 kK and a luminosity of 261 L⊙ assuming a distance of 1200 pc. The central star temperature we derived is significantly higher than the value of 140 kK that was derived by comparing the central star spectrum with PG 1159. Further analysis yielded a 3σ lower limit for the stellar temperature of 165 kK (based on nebular modeling) and a 3σ upper limit of 178 kK (based on a non-detection by Chandra). The upper limit is consistent with the nebular model at the 1σ level. The upper limit would be higher if the extinction towards the central star were more than AV = 0.1 mag, which is plausible.
 -
A comparison of the central star parameters with evolutionary tracks is fraught with many uncertainties. The progenitor of the central star had a mass of at least 3 M⊙, but maybe as high as 7 M⊙.
-
We confirm the finding of Kwitter & Henry (1996) that the nebula is carbon rich, and we derive an improved value of the C/O ratio of 2.1. The nebular abundances are typical for a type IIa PN. They show a moderately high N/O ratio and a mildly enhanced He abundance.
-
With the photoionization model we determined that the grains in the ionized nebula are large. If we use single-sized grains, they would have to have a radius of 0.15 μm to explain the far-IR SED. Most likely these large grains were inherited from the AGB phase.
-
We use the photoionization model to calculate synthetic photometry in various mid- and far-IR photometric systems. That way we can determine to what extent line and continuum emission are contributing in each band. This analysis enabled us to determine that there is a continuum component contributing around 25 μm that is not accounted for by the Cloudy model. This component is however detected in the IRS spectrum. The most plausible explanation is that this comes from stochastically heated very small grains (possibly PAHs). These grains can survive in dense H2 emitting clumps in the torus (together with the larger grains) where they are shielded from the ionizing radiation. The presumed presence of very small grains could also explain the low RV value we find in our dereddening law. However, we know of no direct evidence for the existence of very small grains and more research will be needed to investigate this point.
-
The PACS 70/160 μm temperature map shows evidence for two radiation components heating the grains. One component is confined to the region inside the torus and is quickly absorbed away farther out. The other component shows no evidence for extinction and produces roughly spherical isothermal contours. Using the Cloudy model we could identify the first component as direct emission from the central star, while the second component is diffuse emission from the ionized gas (mainly Lyα).
-
It was previously suggested by Hora et al. (2004) and Ramos-Larios et al. (2008) (based on IRAC images) that NGC 650 contains a PDR surrounding the ionized region. We show that this assumption is incorrect. All the neutral material (including H2) in this nebula is contained in dense clumps inside the ionized region. These clumps have noticeable internal extinction. This is unusual for such a highly evolved PN.
Online material
Log of the various IUE observations used in this paper.
Line fluxes of NGC 650 observed with IUE.
Line fluxes of NGC 650 resulting from combining the two spectra from Kwitter et al. (2003) as discussed in Sect. 3.2.
Line fluxes of NGC 650 observed with Spitzer IRS.
Available on-line at http://irs.ub.rug.nl/ppn/161821650
Acknowledgments
We kindly thank Gerardo Ramos-Larios for making the Hβ image of NGC 650 available to us. We thank Nicholas Lee for his invaluable help in interpreting the Chandra data and we thank the referee for his helpful comments. P.v.H. and the PACS ICC in Leuven wish to acknowledge support from the Belgian Science Policy office through the ESA PRODEX programme. PACS has been developed by a consortium of institutes led by MPE (Germany) and including UVIE (Austria); KU Leuven, CSL, IMEC (Belgium); CEA, LAM (France); MPIA (Germany); INAFIFSI/ OAA/OAP/OAT, LENS, SISSA (Italy); IAC (Spain). This development has been supported by the funding agencies BMVIT (Austria), ESA-PRODEX (Belgium), CEA/CNES (France), DLR (Germany), ASI/INAF (Italy), and CICYT/MCYT (Spain). SPIRE has been developed by a consortium of institutes led by Cardiff Univ. (UK) and including: Univ. Lethbridge (Canada); NAOC (China); CEA, LAM (France); IFSI, Univ. Padua (Italy); IAC (Spain); Stockholm Observatory (Sweden); Imperial College London, RAL, UCL-MSSL, UKATC, Univ. Sussex (UK); and Caltech, JPL, NHSC, Univ. Colorado (USA). This development has been supported by national funding agencies: CSA (Canada); NAOC (China); CEA, CNES, CNRS (France); ASI (Italy); MCINN (Spain); SNSB (Sweden); STFC, UKSA (UK); and NASA (USA). Some of the data presented in this paper were obtained from the Multimission Archive at the Space Telescope Science Institute (MAST). STScI is operated by the Association of Universities for Research in Astronomy, Inc., under NASA contract NAS5-26555. Support for MAST for non-HST data is provided by the NASA Office of Space Science via grant NNX09AF08G and by other grants and contracts. The IRS was a collaborative venture between Cornell University and Ball Aerospace Corporation funded by NASA through the Jet Propulsion Laboratory and Ames Research Center. This publication makes use of data products from the Wide-field Infrared Survey Explorer, which is a joint project of the University of California, Los Angeles, and the Jet Propulsion Laboratory/California Institute of Technology, funded by the National Aeronautics and Space Administration. Data presented in this paper were analyzed using HIPE, a joint development by the Herschel Science Ground Segment Consortium, consisting of ESA, the NASA Herschel Science Center, and the HIFI, PACS, and SPIRE consortia. This research made use of tools provided by Astrometry.net. This research made use of the Atomic Line List available at http://www.pa.uky.edu/~peter/atomic.
References
- Aller, L. H., & Czyzak, S. J. 1983, ApJS, 51, 211 [NASA ADS] [CrossRef] [Google Scholar]
- Althaus, L. G., Córsico, A. H., Miller Bertolami, M. M., García-Berro, E., & Kepler, S. O. 2008, ApJ, 677, L35 [NASA ADS] [CrossRef] [Google Scholar]
- Aniano, G., Draine, B. T., Gordon, K. D., & Sandstrom, K. 2011, PASP, 123, 1218 [NASA ADS] [CrossRef] [Google Scholar]
- Balick, B., Preston, H. L., & Icke, V. 1987, AJ, 94, 1641 [NASA ADS] [CrossRef] [Google Scholar]
- Balick, B., Gonzalez, G., Frank, A., & Jacoby, G. 1992, ApJ, 392, 582 [NASA ADS] [CrossRef] [Google Scholar]
- Blöcker, T. 1995, A&A, 299, 755 [NASA ADS] [Google Scholar]
- Bryce, M., Mellema, G., Clayton, C. A., et al. 1996, A&A, 307, 253 [NASA ADS] [Google Scholar]
- Condon, J. J., & Kaplan, D. L. 1998, ApJS, 117, 361 [NASA ADS] [CrossRef] [Google Scholar]
- Draine, B. T. 2000, ApJ, 532, 273 [NASA ADS] [CrossRef] [Google Scholar]
- Faúndez-Abans, M., & Maciel, W. J. 1987, A&A, 183, 324 [NASA ADS] [Google Scholar]
- Ferland, G. J., Korista, K. T., Verner, D. A., et al. 1998, PASP, 110, 761 [Google Scholar]
- Fitzpatrick, E. L. 1999, PASP, 111, 63 [NASA ADS] [CrossRef] [Google Scholar]
- Frost, C. A., Cannon, R. C., Lattanzio, J. C., Wood, P. R., & Forestini, M. 1998, A&A, 332, L17 [NASA ADS] [Google Scholar]
- Gielen, C., Bouwman, J., Van Winckel, H., et al. 2011, A&A, 533, A99 [NASA ADS] [CrossRef] [EDP Sciences] [Google Scholar]
- Gregory, P. C., Scott, W. K., Douglas, K., & Condon, J. J. 1996, ApJS, 103, 427 [NASA ADS] [CrossRef] [Google Scholar]
- Grevesse, N., Asplund, M., Sauval, A. J., & Scott, P. 2010, Ap&SS, 328, 179 [NASA ADS] [CrossRef] [Google Scholar]
- Griffin, M. J., Abergel, A., Abreu, A., et al. 2010, A&A, 518, L3 [Google Scholar]
- Groenewegen, M. A. T. 2012, A&A, 543, A36 [NASA ADS] [CrossRef] [EDP Sciences] [Google Scholar]
- Groenewegen, M. A. T., Waelkens, C., Barlow, M. J., et al. 2011, A&A, 526, A162 [NASA ADS] [CrossRef] [EDP Sciences] [Google Scholar]
- Hajduk, M., Zijlstra, A. A., Herwig, F., et al. 2005, Science, 308, 231 [NASA ADS] [CrossRef] [PubMed] [Google Scholar]
- Herwig, F. 2005, ARA&A, 43, 435 [NASA ADS] [CrossRef] [Google Scholar]
- Herwig, F. 2008, in IAU Symp. 252, eds. L. Deng, & K. L. Chan, 205 [Google Scholar]
- Higdon, S. J. U., Devost, D., Higdon, J. L., et al. 2004, PASP, 116, 975 [NASA ADS] [CrossRef] [Google Scholar]
- Hora, J. L., Latter, W. B., Allen, L. E., et al. 2004, ApJS, 154, 296 [NASA ADS] [CrossRef] [Google Scholar]
- Houck, J. R., Röllig, T. L., van Cleve, J., et al. 2004, ApJS, 154, 18 [NASA ADS] [CrossRef] [Google Scholar]
- Huggins, P. J., & Healy, A. P. 1989, ApJ, 346, 201 [NASA ADS] [CrossRef] [Google Scholar]
- Huggins, P. J., Bachiller, R., Cox, P., & Forveille, T. 1996, A&A, 315, 284 [NASA ADS] [Google Scholar]
- Iben, Jr. I., ,Kaler, J. B., Truran, J. W., & Renzini, A. 1983, ApJ, 264, 605 [NASA ADS] [CrossRef] [Google Scholar]
- IPAC 1986, Vizier Online Data Catalog, UU/125 [Google Scholar]
- Jura, M., Turner, J., & Balm, S. P. 1997, ApJ, 474, 741 [NASA ADS] [CrossRef] [Google Scholar]
- Kaler, J. B. 1978, ApJ, 226, 947 [Google Scholar]
- Kastner, J. H., Weintraub, D. A., Gatley, I., Merrill, K. M., & Probst, R. G. 1996, ApJ, 462, 777 [NASA ADS] [CrossRef] [Google Scholar]
- Kastner, J. H., Montez, Jr., R., Balick, B., et al. 2012, AJ, 144, 58 [NASA ADS] [CrossRef] [EDP Sciences] [Google Scholar]
- Khromov, G. S. 1989, Space Sci. Rev., 51, 339 [NASA ADS] [CrossRef] [Google Scholar]
- Koornneef, J., & Pottasch, S. R. 1998, A&A, 335, 277 [NASA ADS] [Google Scholar]
- Kwitter, K. B., & Henry, R. B. C. 1996, ApJ, 473, 304 [NASA ADS] [CrossRef] [Google Scholar]
- Kwitter, K. B., Henry, R. B. C., & Milingo, J. B. 2003, PASP, 115, 80 [NASA ADS] [CrossRef] [Google Scholar]
- Latter, W. B., Dayal, A., Bieging, J. H., et al. 2000, ApJ, 539, 783 [NASA ADS] [CrossRef] [Google Scholar]
- Lebouteiller, V., Bernard-Salas, J., Sloan, G. C., & Barry, D. J. 2010, PASP, 122, 231 [NASA ADS] [CrossRef] [Google Scholar]
- Maciel, W. J. 2000, in The Evolution of the Milky Way: Stars versus Clusters, eds. F. Matteucci, & F. Giovannelli (Kluwer Academic Publishers), 81 [Google Scholar]
- Manchado, A., Guerrero, M. A., Stanghellini, L., & Serra-Ricart, M. 1996, The IAC morphological catalog of northern Galactic planetary nebulae [Google Scholar]
- Marquez-Lugo, R. A., Ramos-Larios, G., Guerrero, M. A., & Vázquez, R. 2013, MNRAS, 429, 973 [NASA ADS] [CrossRef] [Google Scholar]
- Martin, P. G., & Rouleau, F. 1991, in Extreme Ultraviolet Astronomy, eds. R. F. Malina, & S. Bowyer (New York: Pergamon Press), 341 [Google Scholar]
- Menut, J.-L., Gendron, E., Schartmann, M., et al. 2007, MNRAS, 376, L6 [NASA ADS] [CrossRef] [Google Scholar]
- Minkowski, R., & Osterbrock, D. 1960, ApJ, 131, 537 [NASA ADS] [CrossRef] [Google Scholar]
- Murakawa, K., Ueta, T., & Meixner, M. 2010, A&A, 510, A30 [NASA ADS] [CrossRef] [EDP Sciences] [Google Scholar]
- Napiwotzki, R., & Schönberner, D. 1995, A&A, 301, 545 [NASA ADS] [Google Scholar]
- Norris, B. R. M., Tuthill, P. G., Ireland, M. J., et al. 2012, Nature, 484, 220 [NASA ADS] [CrossRef] [PubMed] [Google Scholar]
- O’Dell, C. R., Sabbadin, F., & Henney, W. J. 2007, AJ, 134, 1679 [NASA ADS] [CrossRef] [Google Scholar]
- Ott, S. 2010, in Astronomical Data Analysis Software and Systems XIX, eds. Y. Mizumoto, K.-I. Morita, & M. Ohishi, ASP Conf. Ser., 434, 139 [Google Scholar]
- Peimbert, M., & Torres-Peimbert, S. 1987, Rev. Mex. Astron. Astrofis., 14, 540 [Google Scholar]
- Phillips, J. P., Ramos-Larios, G., & Guerrero, M. A. 2011, MNRAS, 415, 513 [NASA ADS] [CrossRef] [Google Scholar]
- Pilbratt, G. L., Riedinger, J. R., Passvogel, T., et al. 2010, A&A, 518, L1 [CrossRef] [EDP Sciences] [Google Scholar]
- Poglitsch, A., Waelkens, C., Geis, N., et al. 2010, A&A, 518, L2 [NASA ADS] [CrossRef] [EDP Sciences] [Google Scholar]
- Pottasch, S. R. 1984, in Planetary nebulae – A study of late stages of stellar evolution, Astrophys. Space Sci. Lib., 107 [Google Scholar]
- Ramos-Larios, G., Phillips, J. P., & Cuesta, L. 2008, MNRAS, 391, 52 [NASA ADS] [CrossRef] [Google Scholar]
- Rauch, T. 1997, A&A, 320, 237 [NASA ADS] [Google Scholar]
- Rauch, T. 2003, A&A, 403, 709 [NASA ADS] [CrossRef] [EDP Sciences] [Google Scholar]
- Roussel, H. 2013, PASP, 125, 1126 [Google Scholar]
- Schönberner, D. 1979, A&A, 79, 108 [NASA ADS] [Google Scholar]
- Stasińska, G., & Szczerba, R. 1999, A&A, 352, 297 [NASA ADS] [Google Scholar]
- Su, K. Y. L., Chu, Y.-H., Rieke, G. H., et al. 2007, ApJ, 657, L41 [NASA ADS] [CrossRef] [Google Scholar]
- Ueta, T. 2006, ApJ, 650, 228 [NASA ADS] [CrossRef] [Google Scholar]
- Ueta, T., Meixner, M., Hinz, P. M., et al. 2001, ApJ, 557, 831 [NASA ADS] [CrossRef] [Google Scholar]
- van Hoof, P. A. M. 1997, Photo-ionization studies of nebulae, Ph.D. Thesis, Rijksuniversiteit Groningen [Google Scholar]
- van Hoof, P. A. M., & Van de Steene, G. C. 1999, MNRAS, 308, 623 [NASA ADS] [CrossRef] [Google Scholar]
- van Hoof, P. A. M., & Van de Steene, G. C., Beintema, D. A., et al. 2000, ApJ, 532, 384 [NASA ADS] [CrossRef] [Google Scholar]
- van Hoof, P. A. M., Hajduk, M., Zijlstra, A. A., et al. 2007, A&A, 471, L9 [NASA ADS] [CrossRef] [EDP Sciences] [Google Scholar]
- van Hoof, P. A. M., & Van de Steene, G. C., Barlow, M. J., et al. 2010, A&A, 518, L137 [NASA ADS] [CrossRef] [EDP Sciences] [Google Scholar]
- van Hoof, P. A. M., Barlow, M. J., Van de Steene, G. C., et al. 2012, IAU Symp., 283, 41 [NASA ADS] [Google Scholar]
- Vassiliadis, E., & Wood, P. R. 1994, ApJS, 92, 125 [NASA ADS] [CrossRef] [Google Scholar]
- Werner, K., & Herwig, F. 2006, PASP, 118, 183 [NASA ADS] [CrossRef] [Google Scholar]
- Werner, K., Heber, U., & Hunger, K. 1991, A&A, 244, 437 [NASA ADS] [Google Scholar]
- Werner, M. W., Röllig, T. L., Low, F. J., et al. 2004, ApJS, 154, 1 [Google Scholar]
- Zuckerman, B., & Gatley, I. 1988, ApJ, 324, 501 [NASA ADS] [CrossRef] [Google Scholar]
All Tables
Line fluxes of NGC 650 resulting from combining the two spectra from Kwitter et al. (2003) as discussed in Sect. 3.2.
All Figures
|
Fig. 1 PACS 70 μm image of NGC 650 shown on a sqrt stretch. The color bar shows the flux density normalized in Jy/pixel. |
| In the text | |
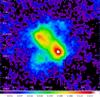 |
Fig. 2 Same as Fig. 1, but showing the PACS 160 μm image. |
| In the text | |
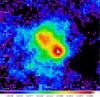 |
Fig. 3 Same as Fig. 1, but showing the SPIRE 250 μm image. |
| In the text | |
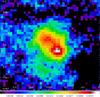 |
Fig. 4 Same as Fig. 1, but showing the SPIRE 350 μm image. |
| In the text | |
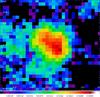 |
Fig. 5 Same as Fig. 1, but showing the SPIRE 500 μm image. |
| In the text | |
|
Fig. 6 Left: Hα image from the IAC Catalog of Northern Galactic PNe (Manchado et al. 1996). The contours of the Hα image are overlaid on the PACS 70 and 160 μm images (middle and right panel, respectively). All images are displayed on a logarithmic scale to reveal the extent of the low-level emission. |
| In the text | |
|
Fig. 7 Temperature map of NGC 650 created from the PACS 70/160 μm ratio image. The black contours are taken from the PACS 160 μm image. The blue cross marks the location of the central star. The bar at the bottom shows the temperature scale. |
| In the text | |
|
Fig. 8 Same as Fig. 7, but showing contours for the grain temperature. Contour levels are from 27.5 to 35.5 K with 1 K increments. |
| In the text | |
|
Fig. 9 Various apertures shown on top of the Hα image taken with the Nordic Optical Telescope (credit: Lars Ø. Andersen, Lars Malmgren, Frank R. Larsen). |
| In the text | |
|
Fig. 10 IUE spectra of NGC 650. Top panel: SWP (short wavelength prime camera) spectrum. Bottom panel: LWP (long wavelength prime camera) spectrum. |
| In the text | |
|
Fig. 11 Spitzer IRS spectra of NGC 650. Top panel: SL1 spectrum. Bottom panel: combined LL1 and LL2 spectra. The broad feature underneath the [Ne v] 14.3 μm line in the SL1 spectrum is an artifact of the detector, the so-called teardrop. The LL spectra are shown on a logarithmic scale to emphasize the continuum emission. |
| In the text | |
|
Fig. 12 SED of the dust in NGC 650. The solid line shows the modified blackbody that was fitted to the observations. |
| In the text | |
|
Fig. 13 Infrared spectrum computed by Cloudy. The far-IR photometry from Table 1 (shown as red diamonds) is also included to demonstrate the quality of the fit. |
| In the text | |
|
Fig. 14 Various components contributing to the grain heating as a function of radius from the central star. |
| In the text | |
|
Fig. 15 WISE 22.1 μm image of NGC 650. The image is normalized in the standard DN units (1 DN = 5.2269 × 10⁻⁵ Jy/pixel). The contours are taken from the PACS 70 μm image. The blue cross marks the position of the central star. |
| In the text | |
Current usage metrics show cumulative count of Article Views (full-text article views including HTML views, PDF and ePub downloads, according to the available data) and Abstracts Views on Vision4Press platform.
Data correspond to usage on the plateform after 2015. The current usage metrics is available 48-96 hours after online publication and is updated daily on week days.
Initial download of the metrics may take a while.