Free Access
Fig. 7
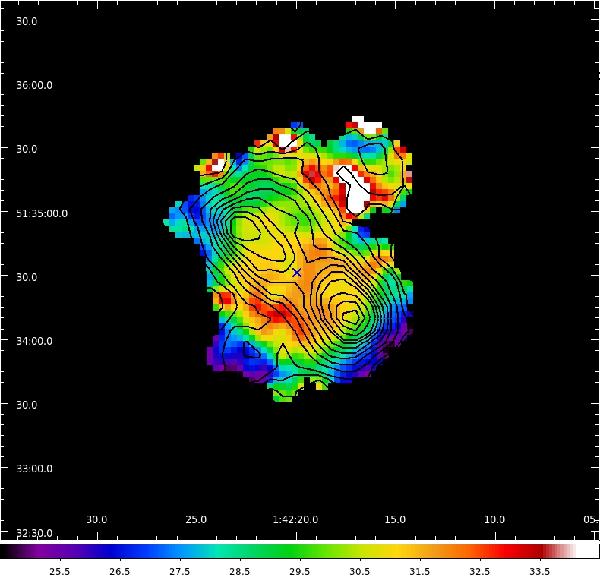
Temperature map of NGC 650 created from the PACS 70/160 μm ratio image. The black contours are taken from the PACS 160 μm image. The blue cross marks the location of the central star. The bar at the bottom shows the temperature scale.
Current usage metrics show cumulative count of Article Views (full-text article views including HTML views, PDF and ePub downloads, according to the available data) and Abstracts Views on Vision4Press platform.
Data correspond to usage on the plateform after 2015. The current usage metrics is available 48-96 hours after online publication and is updated daily on week days.
Initial download of the metrics may take a while.