Free Access
Fig. 6
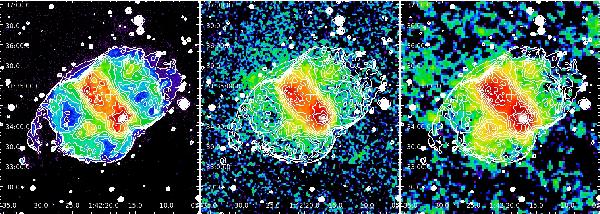
Left: Hα image from the IAC Catalog of Northern Galactic PNe (Manchado et al. 1996). The contours of the Hα image are overlaid on the PACS 70 and 160 μm images (middle and right panel, respectively). All images are displayed on a logarithmic scale to reveal the extent of the low-level emission.
Current usage metrics show cumulative count of Article Views (full-text article views including HTML views, PDF and ePub downloads, according to the available data) and Abstracts Views on Vision4Press platform.
Data correspond to usage on the plateform after 2015. The current usage metrics is available 48-96 hours after online publication and is updated daily on week days.
Initial download of the metrics may take a while.