Free Access
Fig. 11
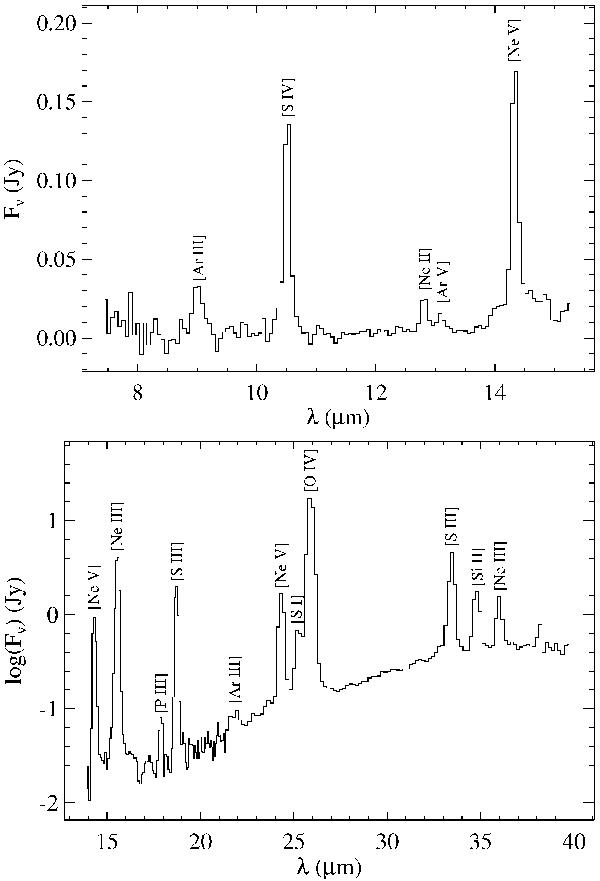
Spitzer IRS spectra of NGC 650. Top panel: SL1 spectrum. Bottom panel: combined LL1 and LL2 spectra. The broad feature underneath the [Ne v] 14.3 μm line in the SL1 spectrum is an artifact of the detector, the so-called teardrop. The LL spectra are shown on a logarithmic scale to emphasize the continuum emission.
This figure is made of several images, please see below:
Current usage metrics show cumulative count of Article Views (full-text article views including HTML views, PDF and ePub downloads, according to the available data) and Abstracts Views on Vision4Press platform.
Data correspond to usage on the plateform after 2015. The current usage metrics is available 48-96 hours after online publication and is updated daily on week days.
Initial download of the metrics may take a while.