Fig. 1
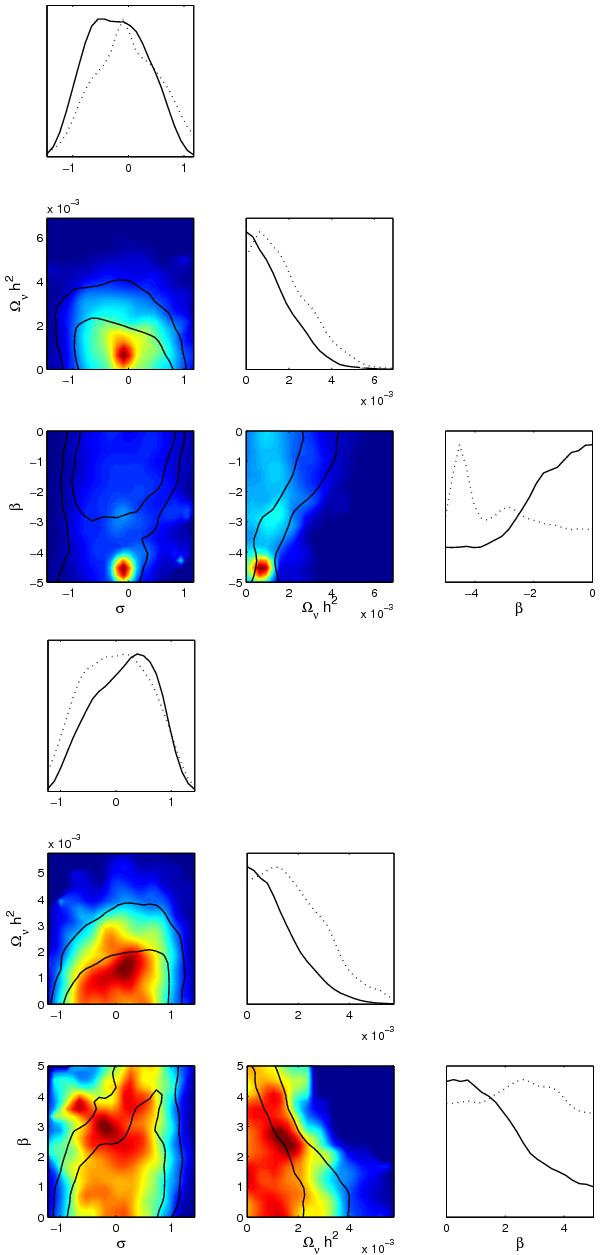
In the upper (lower) panel, likelihood contours and distributions are shown for decreasing (growing) neutrino mass in the exponential potential case. For the plots on the diagonal, dotted (solid) lines are mean (marginalized) likelihoods of samples. Similarly, black lines on the plots exhibit 1- and 2σ contours of the marginalised probability distribution, while the colours refer to the mean likelihood degradation from the top (dark red) to lower values.
Current usage metrics show cumulative count of Article Views (full-text article views including HTML views, PDF and ePub downloads, according to the available data) and Abstracts Views on Vision4Press platform.
Data correspond to usage on the plateform after 2015. The current usage metrics is available 48-96 hours after online publication and is updated daily on week days.
Initial download of the metrics may take a while.