| Issue |
A&A
Volume 560, December 2013
|
|
|---|---|---|
| Article Number | A1 | |
| Number of page(s) | 11 | |
| Section | Interstellar and circumstellar matter | |
| DOI | https://doi.org/10.1051/0004-6361/201220800 | |
| Published online | 28 November 2013 | |
Time delay between the optical and X-ray outbursts in the high-mass X-ray transient A0535+26/HDE245770
1 INAF – Istituto di Astrofisica e Planetologia Spaziali, Area di Ricerca di Tor Vergata, via del Fosso del Cavaliere 100, 00133 Roma, Italy
e-mail: This email address is being protected from spambots. You need JavaScript enabled to view it.
2 Space Research Institute, Profsoyuznaya 84/32, 117810 Moscow, Russia
3 National Research Nuclear University MEPhI, Kashirskoe Shosse 31, 115409 Moscow, Russia
Received: 28 November 2012
Accepted: 3 September 2013
Abstract
The optical behavior of the Be star in the high-mass X-ray transient A0535+26/HDE245770 shows that at periastron the luminosity is typically enhanced by 0.02 to a few tenths mag, and the X-ray outburst occurs eight days after the periastron. We constructed a quantitative model for this event based on a nonstationary accretion disk behavior, connected with a high ellipticity of the orbital motion. We explain the observed time delay between the peaks of the optical and X-ray outbursts in this system by the time of radial motion of the matter in the accretion disk, after an increase of the mass flux in the vicinity of a periastral point in the binary. This time is determined by the turbulent viscosity with a parameter of α = 0.1−0.3. The increase of the mass flux is a sort of flush that reaches the external part of the accretion disk around the neutron star, which enhances the optical luminosity. The subsequent X-ray flare occurs when the matter reaches the hot central parts of the accretion disk and the neutron star’s surface.
Key words: accretion, accretion disks / stars: neutron / X-rays: binaries / X-rays: individuals: A0535+26 / stars: individual: V725 Tau / stars: emission-line, Be
© ESO, 2013
1. Introduction
The X-ray source A 0535+26 was discovered by the Ariel V satellite on April 14, 1975 (Coe et al. 1975). The X-ray source was in outburst with an intensity of ~2 Crab and showed a pulsation with the rate of ~104 s (Rosenberg et al. 1975). The hard X-ray spectrum during the decay from the April 1975 outburst became softer, so that the 19 May spectrum had E-0.8 and the 1 June spectrum E-1.1 (Ricketts et al. 1975).
Between 13 and 19 April, 1975, as the nova brightened, the spectra showed some evidence of steepening. The best fit of the experimental data between roughly 27 and 28 April was compatible with an 8 keV black-body curve (Coe et al. 1975). The X-ray source decayed from the outburst with an e-folding time of 19 days in the energy range of 3−6 keV (Kaluzienski et al. 1975). The Be star HDE 245770 was discovered as the optical counterpart of A 0535+26 by Bartolini et al. (1978), and was classified as an O9.7IIIe star by Giangrande et al. (1980). This is a reliable classification, still resistant to many attacks.
Complete reviews of this system can be found in Giovannelli et al. (1985), Giovannelli & Sabau-Graziati (1992) – hereafter GSG92 –, and Burger et al. (1996).
Briefly, the properties of this system, placed at a distance of 1.8 ± 0.6 kpc (Giangrande et al. 1980), can be summarized as follows: a hard X-ray transient, long-period X-ray pulsar – the secondary star – is orbiting around the primary O9.7IIIe star. The masses are of ~1.5 ± 0.3 M⊙ (Joss & Rappaport 1984; Thorsett et al. 1993; van Kerkwijk et al. 1995), and 15 M⊙ (Giangrande et al. 1980) for the secondary and primary star, respectively. The eccentricity is e = 0.497 (Finger et al. 1994). Usually the primary star does not fill its Roche lobe (de Loore et al. 1984).
This study was motivated by the results reported in Giovannelli & Sabau-Graziati (2011), who reported the discovery of low-energy indicators of high-energy processes. These indicators are the UBVRI magnitudes and Balmer lines of the optical companion. A particularly unusual activity of the primary star – usually at the periastron passage of the neutron star – indicates that an X-ray flare is imminent. The shape and intensity of X-ray outbursts are dependent on the strength of the activity of the primary.
By using two measurements in optical during two identical decays from relative maxima of the luminosity of HDE 245770, Bartolini et al. (1983) determined the orbital period of the system HDE 245770/A 0535+26 as Porb = 110.856 ± 0.002 days. These authors assumed the time of the maximum flare luminosity observed by Rössiger (1978) as the reference maximum, that is, JD(Lmax) = 2 443 496.37 + n × 110.856. Thus, Bartolini et al. (1983) obtained for the maximum of the optical flare of December 5, 1981 (JD 2 444 944.5) (Giovannelli et al. 1985) (hereafter 811205-E; E stands for event) the computed time JD 2 444 937.5, which agrees with the observed time. For this reason Bartolini et al. (1983) gave JD 2 444 944 ± 10 as the time of the occurrence of the 811205-E.
But, because the 811205-E is clearly peaked at that date and triggered the subsequent short X-ray outburst of December 13, 1981 (811213-E; Nagase et al. 1982), Giovannelli & Sabau-Graziati (2011) assumed the ephemeris of the system as JDopt−outb = JD0(2 444 944) ± n(110.856 ± 0.002) days.
From this they concluded that the passage of the neutron star at periastron occurs with a periodicity of 110.856 ± 0.002 days and that the various types of X-ray outbursts of A0535+26 – following the definitions reported in the review by GSG92 – occur just after ~8 days. The intensity of the X-ray outbursts range from ~0.1 − 8 Crab depending on the state of the primary companion O9.7 IIIe star: i) normal outbursts (~0.1 − 0.5) Crab when the O9.7 IIIe star is quiescent (steady stellar wind); ii) anomalous or noisy outbursts (~0.5 − 1.5 Crab) when the O9.7IIIe star is in a turbulent state; some puffs of material, superimposed to the steady stellar wind, are expelled; iii) casual or giant outbursts (~1.5 − 8 Crab) with a very long duration (~10 − 20 days), when the O9.7IIIe star is very active (i.e., expelling a shell). At periastron the optical luminosity increases from ~0.02 to ~0.2 mag from cases i) to iii).
However, using the ephemeris reported in Giovannelli & Sabau-Graziati (2011), the time delay between optical and X-ray outbursts, starting from 811205-E, is becoming longer for the most recent outbursts. This suggests that the orbital period determined by Bartolini et al. (1983) that was also used by Giovannelli & Sabau-Graziati (2011) is slightly too short.
Therefore we here assumed the orbital period determined by Priedhorsky & Terrell (1983) from X-ray data: Porb = 111.0 ± 0.4 days, and the ephemeris JDopt − outb = JD0(2 444 944) ± n(111.0 ± 0.4) days.
The 111-day orbital period agrees within the error bars with many other determinations reported in the literature (from optical data, e.g. Guarnieri et al. 1985; de Martino et al. 1985; Hutchings 1984; Janot-Pacheco et al. 1987. From X-ray data, e.g. Nagase et al. 1982; Priedhorsky & Terrell 1983; Motch et al. 1991; Finger et al. 1996; Coe et al. 2006). Besides, any value of the orbital period of the system within this error bar does not change the conclusions of our paper.
The suggestion that there might be a temporary accretion disk around the X-ray pulsar when it approaches periastron (Giovannelli & Ziółkowski 1990) was confirmed by the X-ray measurements of Finger et al. (1996) and was discussed by Giovannelli et al. (2007), who detected a temporary accretion disk by means of doubling in the He I emission lines.
In the following section we present the experimental results from optical and X-ray measurements of the X-ray/Be system A 0535+26/HDE 245770.
The data acquisition was inhomogeneous, but had the same denominator throughout. This is the epoch of the periastron passage of the neutron star around the Be star, which always occurs about eight days before the X-ray outburst. X-ray and optical measurements were only sometimes taken at the same epoch; sometimes only optical data were obtained, and at other times only X-ray data were available. In the optical data the optical luminosity at the periastron passage shows a relative maximum or the beginning of a decrease. In X-ray data the X-ray outburst follows the periastron passage by about eight days. When both optical and X-ray data are available, optical and X-ray outbursts are separated by about eight days.
2. Some relevant experimental results
In the following we present experimental facts that demonstrate the delay between the relative enhancement of the optical luminosity of HDE 245770 that occurs at the periastron passage and the subsequent X-ray outburst of the X-ray pulsar A0535+26. We divide the experimental facts into three sets:
(i) optical and X-ray data are available around the periastron passage; (ii) optical data are available without X-ray data around the periastron passage; (iii) X-ray data are available, but no optical data are available around the periastron passage. In all the three cases we have plotted a line in correspondence with the periastron passage. In all cases, the X-ray outbursts follow the epoch of the periastron passage by ~eight days.
Figure 1 shows the optical relative maximum luminosity in U, B, and V bands of HDE 245770 occurred on December 5, 1981 (811205-E) (Giovannelli et al. 1985), and on December 13, 1981, when the subsequent X-ray outburst occurred (811213-E) (Nagase et al. 1982). 811205-E was used to provide the ephemeris of the system (JDopt−outb = JD0(2 444 944) ± n(111.0 ± 0.4) days) used in this paper.
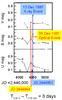 |
Fig. 1 Optical outburst on December 5, 1981 (811205-E) (Giovannelli et al. 1985) is marked with a red line. It occurred eight days before the short and sharp X-ray outburst on December 13, 1981 (811213-E) (Nagase et al. 1982) marked with a blue line. |
Five cycles after 811205-E, optical data in V band (Gnedin et al. 1988) and X-ray data from the Solar Maximum Mission (SMM) in the range 20−163 keV (Sembay et al. 1990), reported in GSG92, are available. Figure 2 reports these data. It is remarkable that the X-ray peak reached on June 18–20, 1983 (JD 2 445 504–506) occurred ~5 − 7 days after the periastron passage where the V luminosity decreased from a relative maximum.
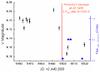 |
Fig. 2 Optical outburst in the V band around the fifth periastron passage after 811205-E. Data are marked with black squares (Gnedin et al. 1988). Red line marks the periastron passage, five cycles after the 811205-E. X-ray data are marked with blue stars (Sembay et al. 1990, reported in GSG92). |
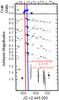 |
Fig. 3 Optical outburst in U, B, V, R, I, and H bands at JD 2 445 610 (Giovannelli et al. 1984) just at the sixth periastron passage after 811205-E. The red line marks the periastron passage, six cycles after 811205-E; X-ray data (reported in GSG92) are marked with blue stars; the blue line marks the maximum of the X-ray outburst. |
After six orbital periods (JD 2 445 610), we found an optical flare in U, B, V, R, I, and H bands (Giovannelli et al. 1984) just ~eight days before the maximum of the X-ray outburst on October 1−18, 1983 (GSG92). Figure 3 shows these events. The red line marks the periastron passage, the blue line the maximum of the X-ray outburst. The blue stars represent the experimental points reported in GSG92 and references therein.
Analyzing the first three figures, it is evident that X-ray outbursts follow the periastron passage by ~eight days. To confirm this conclusion we show the epoch of the December 1977 – January 1978 X-ray outburst of A 0535+26 (Violes et al. 1982). Just a few days before the beginning of the X-ray outburst, expected by Giovannelli’s group, as described in Giovannelli & Sabau-Graziati (2011), Bartolini et al. (1978) detected a decay from an optical flare of HDE 245770, which made its final association with the X-ray pulsar A 0535+26 very likely. Independent of the Bartolini et al. (1978) measurements, Rössiger (1978) detected the maximum of the optical flare at JD +2 443 496.370. Figure 4 shows the optical flare (red stars) constructed from the Bartolini et al. (1978) and Rössiger (1978) data, and the subsequent X-ray outburst (black crosses) (Violes et al. 1982). The data are consistent: the optical flare precedes the beginning of the X-ray outburst by several days, in this case by ~3. The periastron passage 13 cycles before 811205-E is marked with a red line. This passage precedes the maximum of the X-ray outburst in the range 28−40 keV by ~five days.
Figure 5 shows a mosaic of plots in which the V magnitudes of HDE 245770 (Flavia’s star) is reported in various epochs corresponding to the cycles 2, 43, 44, 53, and 56 after 811205-E. In each plot a red line marks the passage at the periastron corresponding to the proper cycle after 811205-E. Unfortunately, no X-ray data are available for these epochs. However, at the periastron passage the optical luminosity is at a relative maximum or very close to it. It is possible to note in Fig. 5a that the optical flare, whose maximum is reached at JD 2 445 062.267, has a magnitude of about 0.1. The similar optical outburst detected in December 1977 (see Fig. 4), which had a magnitude of about 0.17, and reached maximum at JD 2 443 496.370, is separated by the former by just 14.11 Porb.
Several events were detected in the X-ray energy range without corresponding optical data. Three cycles after 811205-E, the epoch of X-ray data from A0535+26 – in the range 1−22 keV from the Hakucho satellite (Nagase et al. 1984) that is reported in Table 1 of GSG92 – follows the periastron passage by ~nine days (see Fig. 6).
Close to the seventh cycle after 811205-E (January 19, 1984 → JD 2 445 720), X-ray data are available from ASTRON satellite in the range 2−25 keV (Giovannelli et al. 1984), reported in GSG92. Figure 7 reports V data (upper panel) and J data (lower panel), marked in black, unfortunately not at periastron, together with the two X-ray points available (JD 2 445 732 and 735), marked with blue stars. It is remarkable that the first X-ray point of the decay of the outburst is placed 11 days after the periastron passage.
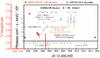 |
Fig. 4 Optical flare of HDE 245770 (Bartolini et al. 1978; Rössiger 1978) (red stars) preceding the X-ray outburst of A 0535+26 (black crosses) (Violes et al. 1982). The red line marks the periastron passage at the thirteenth cycle before 811205-E. |
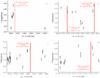 |
Fig. 5 V magnitudes of HDE 245770 at various epochs (black squares). Red lines mark the periastron passages at corresponding cycles after 811205-E. Optical data are taken from Lyuty & Zaitseva (2000), except for the data reported in the upper left panel, which are taken from Gnedin et al. (1988). |
Figure 8 shows the periastron passage on September 17, 1980, which is four cycles before 811205-E. The red line marks the periastron passage and the blue rectangle the epoch of the September–October X-ray outburst that was detected by several experiments whose results are reported in GSG92 and references therein. The few U, B, and V experimental points were reported in Giovannelli et al. (1985). Unfortunately, no optical data are available at periastron. It is impressive that the X-ray outburst follows the periastron passage exactly by eight days. The start of the X-ray outburst is just four orbital periods before the 811213-E, the X-ray short flare that followed the 811205-E.
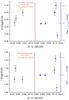 |
Fig. 6 R and I data are marked with black squares (Gnedin et al. 1988). Unfortunately, they are not taken at periastron. The red line marks the periastron passage, 3 cycle after 811205-E. X-ray data are marked with blue stars (Nagase et al. 1984, reported in GSG92) and follow the periastron passage by ~nine days. |
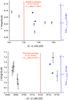 |
Fig. 7 Optical data in V and J bands (black squares) (Gnedin et al. 1988). Unfortunately, they are not taken at periastron. X-ray data (blue stars) (Giovannelli et al. 1984, reported in GSG92) follow the seventh periastron passage after 811205-E (marked with a red line) by ~eleven days. |
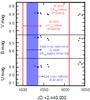 |
Fig. 8 Periastron passage at the fourth cycle before 811205-E (JD 4500) (red line) preceded by ~eight days the X-ray outburst of A 0535+26 that started on JD 4508 ending at JD 4537 (blue rectangle) (GSG92 and references therein). Optical U, B, and V data (black points) are taken from Giovannelli et al. (1985). |
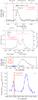 |
Fig. 9 From top to bottom: panel a): 2005 August–September X-ray outburst (Caballero et al. 2007); panel b): 2009 July–August X-ray outburst (Caballero et al. 2010); panel c): 2009 November–December X-ray outburst (Caballero et al. 2011). The blue stars mark Fermi GMB detections (Wilson-Hodge et al. 2009); panel d): 2010 June–August X-ray outburst (Camero-Arranz et al. 2012). The red lines mark the periastron passages at cycles 78, 91, 92, and 94 after 811205-E. |
Figure 9 shows various X-ray outbursts starting ~eight days after the corresponding periastron passage. Panel a shows the 2005 August–September X-ray outburst (Caballero et al. 2007). The periastron passage at cycle 78 after 811205-E occurs ~eight days before the X-ray outburst. Panel b shows the 2009 July–August X-ray outburst (Caballero et al. 2010). The periastron passage at cycle 91 after 811205-E occurs ~3 − 12 days before the double-peaked X-ray outburst. Panel c shows the 2009 November–December X-ray outburst (Caballero et al. 2011); blue stars mark Fermi GMB detections (Wilson-Hodge et al. 2009). The periastron passage at cycle 92 after 811205-E occurs ~ten days before the rise of the X-ray outburst. Panel d shows the 2010 June–August X-ray outburst (Camero-Arranz et al. 2012). The periastron passage at cycle 94 after 811205 (JD 55 364.464) is coincident with the first peak of the double-peaked X-ray outburst and occurs ~30 days before the second peak. This outburst could be an exception that deserves a deep analysis.
Recently, Yan et al. (2012) have found that each giant X-ray outburst occurred in a fading phase of the optical brightness. Moreover, the anti-correlation between the optical brightness and the Hα intensity during their 2009 observations indicates that a mass-ejection event had taken place before the December 2009 giant X-ray outburst that is reported in Fig. 9c and was classified as casual or strong X-ray outburst by GSG92.
To obtain final strong proof of this delay, we used the data of the first detection of A0535+26 (Rosenberg et al. 1975). Figure 10 shows the first X-ray emission detected from A0535+26 (black crosses and points) and the periastron passage at cycle 22 before 811205-E (red line). The X-ray detection of the pulsar starts ~14 days after the periastron passage. No X-ray data are available before it.
In conclusions, it therefore appears evident that the X-ray outbursts occur ~eight days after the periastron passage, which is marked by the optical orbital period of 111.0 days. For short and sharp X-ray outburst such as 811213-E, the time delay with respect to the optical relative maximum (optical flare 811205-E) at the periastron passage is just eight days. This bears witness that Flavia’s star was in a quiescent state (normal X-ray outburst – GSG92: Fig. 1). The same holds for the normal X-ray outbursts reported in Figs. 2, 3, 6, 9a, and 9b. In contrast when Flavia’s star is excited, or expelling a shell, its luminosity increases much more and the following anomalous X-ray outbursts (GSG92) (Figs. 7, and 9d) or casual X-ray outburst (GSG92) (Figs. 4, 9c, and 10) are much more intense, are longer, and start about eight days after the periastron passage where the optical flares occur, and develop for many days. The exception is the double-peaked X-ray outburst of Fig. 9d, for which it is reasonable to assume that it occurred by chance because of a particular excited state of the optical companion. The highest intensity of this X-ray outburst was ~1.4 Crab (Caballero et al. 2011).
Thus we can say that the A0535+26/Flavia’s star system experiences an optical luminosity enhancement of ~0.02 − 0.2 mag, peaked at the periastron passage of the neutron star followed after ~eight days, by X-ray outbursts with an intensity dependent on the optical activity. To explain this delay quantitatively we have developed a model that we describe in the following sections.
3. Observational properties of the X-ray transient A0535+26/HDE245770
The observed orbital period P and eccentricity e are
 From Kepler’s law we have the relation
  (1)where M = 14 M⊙ and m = 1.4 M⊙ are the masses of the optical and neutron stars (used in this paper), respectively. The large semi-axis of the orbit a and the minimal separation of the stars at periastron rmin from Eq. (1) are determined as (Landau & Lifshitz 1988)
 ![Mathematical equation: \begin{eqnarray} a &=& \sqrt[3]{{\frac{M}{{{M_{\odot}}}}}}{\left(\frac{P}{{{P_{\rm Earth}}}}\right)^{2/3}}\sqrt[3]{{1 + \frac{m}{M}}}\approx 1.8 \times 10^{13}\, {\rm cm}, \label{eq2} \\ {r_{\min }} &= & a(1 - e)\approx 9.6 \times 10^{12}\, {\rm cm}, \label{eq3} \end{eqnarray}](/articles/aa/full_html/2013/12/aa20800-12/aa20800-12-eq53.png) where PEarth = 1 year. In quasistatic approximation, the radius of the Roche lobe around the neutron star rroche at periastron may be written (Eggleton 1983)
where PEarth = 1 year. In quasistatic approximation, the radius of the Roche lobe around the neutron star rroche at periastron may be written (Eggleton 1983) 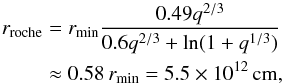 (4)where q is the mass ratio
 |
Fig. 10 Periastron passage at cycle 22 before 811205-E (JD 2502) (red line) precedes the X-ray outburst of A 0535+26 by ~14 days which starts approximately on JD 2516 (Rosenberg et al. 1975). |
4. Time-delay model
Assuming that in the vicinity of the periastron the mass flux Ṁ rapidly increases and reaches Ṁ ≈ 10-7M⊙/year. We consider here Ṁ as a mass flux trough the accretion disk that enters the neutron star. This mass flux during the flare is much higher than the possible flux during the quiescent phase, during which the disk is probably absent (Giovannelli et al. 2007). Therefore we neglected this hypothetical small flux in our further considerations. The outer parts of the accretion disk become hotter, which increases the optical luminosity (optical flush). Owing to the high turbulent viscosity, the wave of the high mass flux propagates to the central object. When this wave reaches the vicinity of the neutron star, the X-ray luminosity increases due to appearance of a hot accretion-disk region and due to the rapid increase of the luminosity when the accretion flow is channeled by the magnetic field and falls onto the magnetic poles (Bisnovatyi-Kogan 2010; Bisnovatyi-Kogan & Fridman 1969).
We identify the time delay τ between the optical and X-ray flashes with the time during which the wave of a high-mass accretion flux, starting from the outer surface rout, reaches the central compact star radius rin. The speed of this wave is approximately equal to the radial speed vr of the matter in the accretion disk, which corresponds to this high-mass flux. The time delay τ is calculated below in this model.
For simplicity, we considered the geometrically thin, optically thick accretion disk without advection around a compact object. We assumed that at each radius with Ṁ(r,t), the accretion disk parameters are the same as in the stationary accretion disk with the same Ṁ over the whole disk (rapid relaxation approximation). The system of equations that describes this disk in a locally stationary approximation has the following form (Shakura & Sunyaev 1973; Bisnovatyi-Kogan 2010): the mass conservation equation is  (5)The angular momentum equation is
  (6)After integration, this reduces to the form
  (7)where l = Ωr2 is a specific angular momentum, and trφ = −αP is the (r,φ) component of the viscosity tension tensor (Shakura & Sunyaev 1973). The other components of this tensor are assumed to be negligibly small; Ω is the Kepler angular velocity Ω2 = GM/r3. The value of the lin is determined by the angular momentum at the inner boundary of the accretion disk, with zero derivative of the angular velocity. For accretion into a black hole this corresponds to the Keplerian angular momentum at the last stable orbit, at
  . For accretion into a nonmagnetized, slowly rotating neutron star rin is close to its radius Rns (Bisnovatyi-Kogan 2010). For a strongly magnetized star, where the Alfvén radius rA ≫ Rns a definition of the inner radius and inner angular momentum are less clear because the matter flows along the field lines to magnetic poles from the Alfvén surface and the disk model failed. In our problem the time delay is determined by a slow radial motion in the outer parts of the accretion disk, where l ≫ lin and therefore the choice of the value of lin is not as important. For simplicity, we used the value that formally corresponds to the black hole. The local equation of energy conservation (Shakura & Sunyaev 1973) is written as
  (8)where Q+ is the energy production rate by a viscous dissipation, related to the unit of the disk surface,
  (9)and Q− is a radiative flux from the optically thick disk through the unit of the disk surface
  (10)Here T is the temperature, a is the constant of the radiation density, and τ0 = κρh is the Thomson optical depth, given by τ0 = 0.4ρh for a hydrogen composition. The pressure Ptot is determined by a mixture of matter Pgas and radiation Prad as
  (11)Here the gas and radiation pressures are given by a standard formula where ℛ is the gas constant. This system of equations is reduced to a single algebraic nonlinear equation for the sound speed cs (Artemova et al. 1996)
 ![Mathematical equation: \begin{equation} c_{\rm s}^2 + \frac{{\dot M\kappa r\Omega '{c_{\rm s} }}}{8 \pi c}f - \sqrt[4]{{-\frac{{{{\dot M}^2 R^4 \kappa }{f^2}r\Omega '{\Omega ^2}}}{{32 \pi^2 a c \alpha c_{\rm s} ^2}}}} = 0, \hfill \label{eq15} \end{equation}](/articles/aa/full_html/2013/12/aa20800-12/aa20800-12-eq94.png) (12)where
(12)where  , and
, and  . Solving this equation, we find cs. The radial velocity of the matter in the disk is given by the formula
  (13)The parameters that we can change in our problem are the viscosity parameter α and the initial mass flux function Ṁ(r). The mass of the neutron star is assumed to be known with sufficient accuracy from the observations. We assumed that the flush of matter occurs when the neutron star passes around periastron. The initial distribution of matter flux in the disk is defined as follows:
 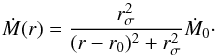 (14)Here r(t) defines the Lagrangian radius of the disk matter, r0 = 1.1 × 1011 cm is the point of the maximum mass flux over the disk at the initial time, and rσ = 3.2 × 1010 cm is a parameter that determines the characteristic width of the high-mass flux region. We took, for the most intensive outburst, Ṁ0 = 10-7 M⊙/year as the maximum value of Ṁ (Persi et al. 1979), Ṁ0 = 3 × 10⁻⁸ M⊙/year and Ṁ0 = 10-8 M⊙/year for weaker outbursts (de Loore et al. 1984). The disk is formed at radius r0, at which the velocity, vflow, of the matter flowing out from the star is of the order of the Keplerian velocity
  . For the above-mentioned r0 a reasonable value of the outflow velocity is vflow ≈ 410 km s-1. Furthermore, knowing the local solution for the radial velocity of matter vr, for the structure of the disk at some point r in time t we find the time evolution of the initial distribution of matter, in the time interval dt by the formula
  (15)The total mass falling onto the neutron star during the flare in this model is determined by the initial Ṁ distribution (Eq. (14)). In the locally static approximation a surface density of the accretion disk at the radius r depends on the local value of Ṁ as well as on M and α. The physical conditions in the accretion disk at radius r ~ r0 are characterized by a gas pressure and Krammers opacity. The surface density Σ in this region is written according to Bisnovatyi-Kogan (2010), taking the system parameters
 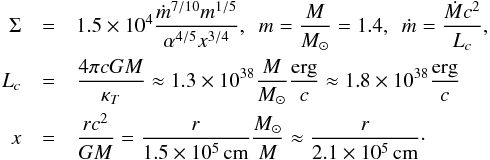 (16)Introducing
  , we obtain
 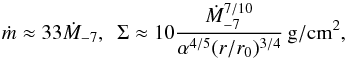 (17)where r0 = 1.1 × 1011 cm. The mass falling onto the neutron star during the flare Mflare is obtained by integrating Σ over the disk, with the distribution of the Ṁ from Eq. (14). We have
 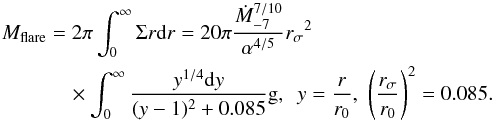 (18)The integral in Eq. (18) converges rapidly in both limits, therefore we may integrate from zero to infinity with only small error. Taking into account rσ = 3.2 × 10¹⁰ and integrating
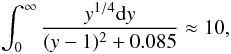 we obtain the value of Mflare in the form
 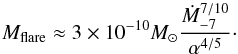 (19)During the luminous phases the radiation comes from the disk radius, which is much smaller than the initial one, and whose opacity is determined mainly by Thomson scattering. This is taken into account in the subsequent calculations. Knowing how the matter in the disk moves, we can calculate the variation of the luminosity of the disk with time in the optical and X-ray ranges. The luminosity of this object consists of two components: emission from the disk and emission from hot spots, which are formed on the neutron star by matter falling onto the magnetic poles (Fig. 11).
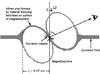 |
Fig. 11 Sketch of the accretion flow in a disk that picked up by a strong neutron star magnetic field. |
The integrated luminosity of the disk is determined by the following formula: 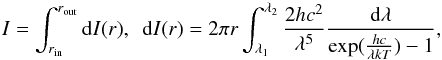 (20)where dI(r) is radiation coming from an elementary ring at the radius r, and thickness dr, in the wavelength range from λ1 to λ2, calculated by the formula of blackbody radiation at temperature T. To calculate the integrated luminosity in the optical band, the integral (Eq. (16)) was calculated in the range 300−700 nm, and for the luminosity in the X-rays band it was computed in the range 2−10 keV.
The second component of the radiation comes from the hot spots. These are formed at the magnetic poles of the neutron star due to infall of matter from the disk along the magnetic field lines. The magnetic field lines form a column of matter over the poles of the neutron star. The angular size of the bottom of the column on the neutron star surface is approximately defined by the expression  (Baan & Treves 1973), where rns is the radius of the neutron star and rA is the radius of the Alfvénic surface, which is determined by the following expression (Lamb et al. 1973):
 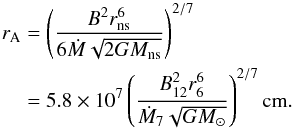 (21)For our system the equatorial magnetic field on the neutron star surface is taken equal to B = 4 × 10¹² G (Terada et al. 2006), the maximum accretion rate Ṁ0 ≈ 10-7 M⊙/year (Persi et al. 1979), and the radius of the neutron star rns = 10 km. Knowing the size of the hot spots, it is possible to estimate their effective temperature,
  (22)where
  is the surface of the hot spot,
  is the efficiency of the conversion of the kinetic energy of falling matter into radiation. Knowing the effective temperature and the surface of the hot spot, it is possible to calculate the radiation power in the optical and X-ray spectral bands, similar to the accretion disk.
5. Results
We have calculated the time dependence of the radiation power of the object in the optical (300−700 nm) and X-rays (2−10 keV) ranges. The results for the light curves of the system in these two bands are given in Fig. 12. Upper, middle, and lower panels of Fig. 12 refer to different values of Ṁ0 and α, as indicated in the figures. The bolometric luminosity is also reported in each panel.
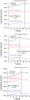 |
Fig. 12 Time dependence of the: i) bolometric luminosity of the object (black line), ii) X-rays in the 2−10 keV band (red line), and iii) optical in the 300−700 nm band (broken blue line). The black vertical line marks the X-ray (2−10 keV) flash occurrence about eight days after the maximum of the optical curve. Ṁ is taken from (14), with the following Ṁ0: upper panel: Ṁ0 = 10-7 M⊙/year, α = 0.1. Middle panel: Ṁ0 = 3 × 10⁻⁸ M⊙/year, α = 0.3. Lower panel: Ṁ0 = 10-8 M⊙/year, α = 0.3. |
This shows that the maxima of the time dependence of the light curves in different bands are shifted relative to each other. The maximum radiation in the X-ray range is reached later than the maximum radiation at optical wavelengths. The main parameter of the problem that we have been able to vary is the Shakura-Sunyaev viscosity parameter α for the accretion disk. The time delay between the peaks in the optical and X-ray is directly dependent on this parameter. We found that the time delay between the maxima of the X-ray and optical emissions that we need to explain the observational data (for the object A0535+26/HDE245770 it is equal to eight days) is reached at a value of the viscosity parameter α ≈ 0.1 for a powerful flash with Ṁ0 = 10-7 M⊙/year (Fig. 12, upper panel); and at a value of the viscosity parameter α ≈ 0.3 for flashes with Ṁ0 = 3 × 10⁻⁸ M⊙/year, and Ṁ0 = 10-8 M⊙/year (Fig. 12 middle and lower panels, respectively). The maximum and minimum values of Ṁ0 were derived from Persi et al. (1979) and de Loore et al. (1984), respectively. The mass of the gas falling onto the neutron star during the flare was found from Eq. (19), 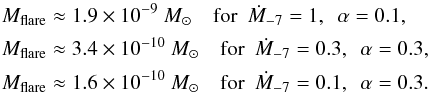 (23)This delay can be explained quite simply. At the beginning the disk was formed by the strong increase of the mass flux when the neutron star approached the periastron of the orbit. The main emission initially came from outside, relatively cold regions of the disk, and the maximum luminosity took effect just at the optical range. The matter flux rate in the inner parts of the disk was low at this stage and the contribution of the whole disk to the X-ray luminosity was weak. The mass flowed from the outer to the inner regions as a result of the disk evolution.
The contribution of the outer regions to the optical radiation decreased, while the contribution of the radiation from inner hot disk in the X-ray band increased. The radiation from the hot spots at the poles of the neutron star was added, which contributed significantly to the X-ray radiation.
Figure 13 shows the radial dependence of the accretion rate in the disk. It is evident from Fig. 13 that the graphs of the time dependence of the radiation power on X-rays is asymmetrical with respect to the maximum. The radiation power increases more rapidly than it decreases. This is because the initial symmetric distribution of matter in the disk during its evolution becomes asymmetrical. This is consistent with the observed asymmetry in the X-ray light curves of A 0535+26.
A similar behavior may be expected in other high-mass transient systems with highly eccentric orbits. The time delay between optical luminosity enhancement – which occurs at periastron – and X-ray flashes with asymmetric light curves is expected to be similar to that measured in A0535+26/HDE245770.
According to our model, during the decreasing flow onto the accreting star, the increase of the luminosity is expected to always start from the low-energy part of the spectra, and the maximum in the high-energy band follows that in the low-energy band. This fact can be clearly seen in Fig. 4 where the maximum of the X-ray outburst in the range 2−10 keV (SAS III measures) is reached ~eight days before the maximum in the range 28−40 keV (Prognoz 6 satellite – Signe II experiment measures).
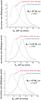 |
Fig. 13 Radial dependence of the accretion rate onto the disk. The accretion rate is given in the units of the Eddington accretion rate, and R8 is given in 108 cm units. The solid line shows the initial distribution, the broken line shows the distribution of accretion rate on the disk after 40 days of evolution. Ṁ is taken from (14), with the following Ṁ0: upper panel: Ṁ0 = 10-7 M⊙/year, α = 0.1. Middle panel: Ṁ0 = 3 × 10⁻⁸ M⊙/year, α = 0.3. Lower panel: Ṁ0 = 10-8 M⊙/year, α = 0.3. |
This is in contrast to what occurs during the ejection of the hot gas from a star or active galactic nucleus (AGN), where the luminosity increase starts from the high-energy side, and the maximum in the low-energy part occurs later.
6. Conclusions
We were able to show that A0535+26/Flavia’s star system scans the neutron star passage at periastron with a periodicity Porb = 111.0 ± 0.4 days. The ephemeris we used – JDopt − outb = JD0(2 444 944) ± n(111.0 ± 0.4) days – was derived from the orbital period of the system and from the optical flare of December 5, 1981 (811205-E), followed by the X-ray flare of December 13, 1981 (811213-E). The passage of A0535+26 at the periastron occurs about eight days before any type of X-ray outburst, except for that in June–August 2010.
It is evident that the very strong X-ray outbursts, named casual outbursts by GSG92, also follow the periastron passage by about eight days. Indeed, even when a shell is ready to be expelled from the O9.7 IIIe star, the event is triggered at periastron because of the gravitational-corkscrew rule. A huge amount of matter is falling onto the temporary accretion disk around the neutron star and increases the optical luminosity. This matter slowly flows onto the neutron star, where it produces the strong X-ray outburst eight days later. This evidence is clearly confirmed from the light curve of A0535+26 (Rosenberg et al. 1975), whose X-ray source was detected by the Ariel V satellite: the detection of the outburst started on April 13, 1975 (the first Ariel V measure), and the periastron passage – in agreement with our ephemeris – occurred on March 30, 1975 (JD 2 442 502), ~14 days before the beginning of the X-ray outburst, exactly 22 orbital periods before 811205-E (see Fig. 10).
We constructed a quantitative model of this event based on a nonstationary accretion disk behavior connected with a high ellipticity of the orbital motion. The observed time delay is related to the motion of a high-mass flux region from the outer boundary of the NS Roche lobe to the Alfvén surface due to the action of the α–viscosity. For bright outbursts the delay of eight days occurs for α = 0.1.
Our model may be valid also for AGNs. Indeed, Nandra et al. (1998) found a delay of ~four days between UV and X-ray emissions in NGC 7469; Maoz et al. (2000) found a delay of ~100 days between optical and X-ray emissions in the Seyfert galaxy NGC 3516; Marshall et al. (2008) found a delay of ~15 days between optical and X-ray emissions in Mkr 509, and Doroshenko et al. (2009) found a delay of ~ten days between R, I and X-ray luminosities in the Seyfert galaxy 3C 120.
It is interesting that a short qualitative explanation of these lags in AGNs, very similar to our quantitative model, was suggested by Marshall et al. (2008).
Acknowledgments
We would like to thank the anonymous referee for his/her very useful suggestions that made this paper much clearer, and Mr Francesco Reale and Mr Massimo Frutti for their help in the preparation of several figures. This research made use of NASA’s Astrophysics Data System. The work of G.S.B.K. and A.S.K. was partially supported by the Russian Foundation for Basic Research grant 11-02-00602, the RAN Program “Origin, formation and evolution of stars and galaxies”, and the Russian Federation President Grant for Support of Leading Scientific Schools NSh-5440.2012.2.
References
- Artemova, I. V., Bisnovatyi-Kogan, G. S., Bjoernsson, G., & Novikov, I. D. 1996, ApJ, 456, 119 [NASA ADS] [CrossRef] [Google Scholar]
- Baan, W. A., & Treves, A. 1973, A&A, 22, 421 [NASA ADS] [Google Scholar]
- Bartolini, C., Guarnieri, A., Piccioni, A., Giangrande, A., & Giovannelli, F. 1978, IAU Circ. 3167 [Google Scholar]
- Bartolini, C., Bianco, G., Guarnieri, A., Piccioni, A., & Giovannelli, F. 1983, Hvar Obs. Bull., 7, 159 [NASA ADS] [Google Scholar]
- Bisnovatyi-Kogan, G. S., & Fridman, A. M. 1969, Astron. Zh., 46, 721 [NASA ADS] [Google Scholar]
- Bisnovatyi-Kogan, G. S. 2010, in Stellar Physics. Stellar evolution and stability, 2nd edn. (Berlin, Heidelberg: Springer), 2 [Google Scholar]
- Burger, M., van Dessel, E. L., Giovannelli, F., et al. 1996, in Multifrequency Behaviour of High Energy Cosmic Sources, eds. F. Giovannelli, & L. Sabau-Graziati, Mem. SAIt., 67, 365 [Google Scholar]
- Caballero, I., Kretschmar, P., Santangelo, A., et al. 2007, A&A, 465, L21 [NASA ADS] [CrossRef] [EDP Sciences] [Google Scholar]
- Caballero, I., Kretschmar, P., Pottschmidt, K., et al. 2010, AIPC, 1248, 147 [NASA ADS] [Google Scholar]
- Caballero, I., Pottschmidt, K., Santangelo, A., et al. 2011, PoS, accepted [arXiv:1107.3417] [Google Scholar]
- Camero-Arranz, A., Finger, M. H., Wilson-Hodge, C. A., et al. 2012, ApJ, 754, 20 [NASA ADS] [CrossRef] [Google Scholar]
- Coe, M. J., Carpenter, G. F., Engel, A. R., & Quenby, J. J. 1975, Nature, 256, 630 [NASA ADS] [CrossRef] [Google Scholar]
- Coe, M. J., Reig, P., McBride, V. A., Galache, J. L., & Fabregat, J. 2006, MNRAS, 368, 447 [NASA ADS] [CrossRef] [Google Scholar]
- de Martino, D., Vittone, A., Giovannelli, F., et al. 1985, in Multifrequency Behaviour of Galactic Accreting Sources, Proc. 1984 Frascati Workshop, ed. F. Giovannelli (Roma: Scientifiche SIDEREA), 326 [Google Scholar]
- de Loore, C., Giovannelli, F., van Dessel, E. L., et al. 1984, A&A, 141, 279 [NASA ADS] [Google Scholar]
- Doroshenko, V. T., Sergeev, S. G., Efimov, Yu. S., Klimanov, S. A., & Nazarov, S. V. 2009, Astron. Lett., 35, 361 [NASA ADS] [CrossRef] [Google Scholar]
- Eggleton, P. P. 1983, ApJ, 268, 368 [NASA ADS] [CrossRef] [Google Scholar]
- Finger, M. H., Cominsky, L. R., Wilson, R. B., Harmon, B. A., & Fishman, G. J. 1994, in The Evolution of X-Ray Binaries, eds. S. S. Holt, & C. S. Day, AIP Conf. Proc., 308, 459 [Google Scholar]
- Finger, M. H., Wilson, R. B., & Harmon, B. A. 1996, ApJ, 459, 288 [NASA ADS] [CrossRef] [Google Scholar]
- Giangrande, A., Giovannelli, F., Bartolini, C., Guarnieri, A., & Piccioni, A. 1980, A&AS, 40, 289 [NASA ADS] [Google Scholar]
- Giovannelli, F., & Sabau-Graziati, L. 1992, SSRv, 59, 1 (GSG92) [NASA ADS] [CrossRef] [Google Scholar]
- Giovannelli, F., & Sabau-Graziati, L. 2011, Acta Polytechnica, 51, 21 [Google Scholar]
- Giovannelli, F., & Ziółkowski, J. 1990, AcA, 40, 95 [NASA ADS] [Google Scholar]
- Giovannelli, F., Ferrari-Toniolo, M., Persi, P., et al. 1984, in X-Ray Astronomy 84, eds. M. Oda, & R. Giacconi, 205 [Google Scholar]
- Giovannelli, F., Ferrari-Toniolo, M., Persi, P., et al. 1985, in Multifrequency Behaviour of Galactic Accreting Sources, Proc. 1984 Frascati Workshop, ed. F. Giovanelli (Roma: Scientifiche SIDEREA), 284 [Google Scholar]
- Giovannelli, F., Bernabei, S., Rossi, C., & Sabau-Graziati, L. 2007, A&A, 475, 651 [NASA ADS] [CrossRef] [EDP Sciences] [Google Scholar]
- Gnedin, Y. N., Zaitseva, G. V., Larionov, V. M., et al. 1988, Sov. Astron., 32, 624 [NASA ADS] [Google Scholar]
- Guarnieri, A., Bartolini, C., Piccioni, A., & Giovannelli, F. 1985, in Multifrequency Behaviour of Galactic Accreting Sources, Proc. 1984 Frascati Workshop, ed. F. Giovannelli (Roma: Scientifiche SIDEREA), 310 [Google Scholar]
- Hutchings, J. B. 1984, PASP, 96, 312 [NASA ADS] [CrossRef] [Google Scholar]
- Janot-Pacheco, E., Motch, C., & Mouchet, M. 1987, A&A, 177, 91 [NASA ADS] [Google Scholar]
- Joss, P. C., & Rappaport, S. A. 1984, ARA&A, 22, 537 [NASA ADS] [CrossRef] [Google Scholar]
- Kaluzienski, L. J., Holt, S. S., Boldt, E. A., & Serlemitsos, P. J. 1975, Nature, 256, 633 [NASA ADS] [CrossRef] [Google Scholar]
- Lamb, F. K., Pethick, C. J., & Pines, D. 1973, ApJ, 184, 271 [NASA ADS] [CrossRef] [Google Scholar]
- Landau, L. D., & Lifshitz, E. M. 1988, Mechanics. Nauka. Moscow, 1 [Google Scholar]
- Lyuty, V. M., & Zaitseva, G. V. 2000, Astron. Lett., 26, 9 [Google Scholar]
- Maoz, D., Edelson, R., & Nandra, K. 2000, AJ, 119, 119 [NASA ADS] [CrossRef] [Google Scholar]
- Marshall, K., Ryle, W. T., & Miller, H. R. 2008, ApJ, 677, 880 [NASA ADS] [CrossRef] [Google Scholar]
- Motch, C., Stella, L., Janot-Pacheco, E., & Mouchet, M. 1991, ApJ, 369, 490 [NASA ADS] [CrossRef] [Google Scholar]
- Nagase, F., Hayakawa, S., Kunieda, H., et al. 1982, ApJ, 263, 814 [NASA ADS] [CrossRef] [Google Scholar]
- Nagase, F., Hayakawa, S., Tsuneo, K., et al. 1984, PASJ, 36, 667 [NASA ADS] [Google Scholar]
- Nandra, K., Clavel, J., Edelson, R. A., et al. 1998, ApJ, 505, 594 [NASA ADS] [CrossRef] [Google Scholar]
- Persi, P., Ferrari-Toniolo, M., Spada, G., et al. 1979, MNRAS, 187, 293 [NASA ADS] [Google Scholar]
- Priedhorsky, W. C., & Terrell, J. 1983, Nature, 303, 681 [NASA ADS] [CrossRef] [Google Scholar]
- Ricketts, M. J., Turner, M. J. L., Page, C. G., & Pounds, K. A. 1975, Nature, 256, 631 [NASA ADS] [CrossRef] [Google Scholar]
- Rosenberg, F. D., Eyles, C. J., Skinner, G. K., & Willmore, A. P. 1975, Nature, 256, 628 [Google Scholar]
- Rössiger, S. 1978, IBVS, 1395 [Google Scholar]
- Sembay, S., Schwartz, R. A., Orwig, L. E., Dennis, B. R., & Davies, S. R. 1990, ApJ, 351, 675 [NASA ADS] [CrossRef] [Google Scholar]
- Shakura, N. I., & Sunyaev, R. A. 1973, A&A, 24, 337 [NASA ADS] [Google Scholar]
- Terada, Y., Mihara, T., Nakajima, M., et al. 2006, ApJ, 648, L139 [NASA ADS] [CrossRef] [Google Scholar]
- Thorsett, S. E., Arzoumanian, Z., McKinnon, M. M., & Taylor, J. H. 1993, ApJ, 405, L29 [NASA ADS] [CrossRef] [Google Scholar]
- van Kerkwijk, M. H., van Paradijs, J., & Zuiderwijk, E. J. 1995, A&A, 303, 497 [NASA ADS] [Google Scholar]
- Violes, F., Niel, M., Bui-van, A., et al. 1982, ApJ, 263, 320 [NASA ADS] [CrossRef] [Google Scholar]
- Wilson-Hodge, C. A., Colleen, A., Finger, M. H., et al. 2009, ATel. 2324 [Google Scholar]
- Yan, J., Li, H., & Liu, Q. 2012, ApJ, 744, 37 [NASA ADS] [CrossRef] [Google Scholar]
All Figures
|
Fig. 1 Optical outburst on December 5, 1981 (811205-E) (Giovannelli et al. 1985) is marked with a red line. It occurred eight days before the short and sharp X-ray outburst on December 13, 1981 (811213-E) (Nagase et al. 1982) marked with a blue line. |
| In the text | |
|
Fig. 2 Optical outburst in the V band around the fifth periastron passage after 811205-E. Data are marked with black squares (Gnedin et al. 1988). Red line marks the periastron passage, five cycles after the 811205-E. X-ray data are marked with blue stars (Sembay et al. 1990, reported in GSG92). |
| In the text | |
|
Fig. 3 Optical outburst in U, B, V, R, I, and H bands at JD 2 445 610 (Giovannelli et al. 1984) just at the sixth periastron passage after 811205-E. The red line marks the periastron passage, six cycles after 811205-E; X-ray data (reported in GSG92) are marked with blue stars; the blue line marks the maximum of the X-ray outburst. |
| In the text | |
|
Fig. 4 Optical flare of HDE 245770 (Bartolini et al. 1978; Rössiger 1978) (red stars) preceding the X-ray outburst of A 0535+26 (black crosses) (Violes et al. 1982). The red line marks the periastron passage at the thirteenth cycle before 811205-E. |
| In the text | |
|
Fig. 5 V magnitudes of HDE 245770 at various epochs (black squares). Red lines mark the periastron passages at corresponding cycles after 811205-E. Optical data are taken from Lyuty & Zaitseva (2000), except for the data reported in the upper left panel, which are taken from Gnedin et al. (1988). |
| In the text | |
|
Fig. 6 R and I data are marked with black squares (Gnedin et al. 1988). Unfortunately, they are not taken at periastron. The red line marks the periastron passage, 3 cycle after 811205-E. X-ray data are marked with blue stars (Nagase et al. 1984, reported in GSG92) and follow the periastron passage by ~nine days. |
| In the text | |
|
Fig. 7 Optical data in V and J bands (black squares) (Gnedin et al. 1988). Unfortunately, they are not taken at periastron. X-ray data (blue stars) (Giovannelli et al. 1984, reported in GSG92) follow the seventh periastron passage after 811205-E (marked with a red line) by ~eleven days. |
| In the text | |
|
Fig. 8 Periastron passage at the fourth cycle before 811205-E (JD 4500) (red line) preceded by ~eight days the X-ray outburst of A 0535+26 that started on JD 4508 ending at JD 4537 (blue rectangle) (GSG92 and references therein). Optical U, B, and V data (black points) are taken from Giovannelli et al. (1985). |
| In the text | |
|
Fig. 9 From top to bottom: panel a): 2005 August–September X-ray outburst (Caballero et al. 2007); panel b): 2009 July–August X-ray outburst (Caballero et al. 2010); panel c): 2009 November–December X-ray outburst (Caballero et al. 2011). The blue stars mark Fermi GMB detections (Wilson-Hodge et al. 2009); panel d): 2010 June–August X-ray outburst (Camero-Arranz et al. 2012). The red lines mark the periastron passages at cycles 78, 91, 92, and 94 after 811205-E. |
| In the text | |
|
Fig. 10 Periastron passage at cycle 22 before 811205-E (JD 2502) (red line) precedes the X-ray outburst of A 0535+26 by ~14 days which starts approximately on JD 2516 (Rosenberg et al. 1975). |
| In the text | |
|
Fig. 11 Sketch of the accretion flow in a disk that picked up by a strong neutron star magnetic field. |
| In the text | |
|
Fig. 12 Time dependence of the: i) bolometric luminosity of the object (black line), ii) X-rays in the 2−10 keV band (red line), and iii) optical in the 300−700 nm band (broken blue line). The black vertical line marks the X-ray (2−10 keV) flash occurrence about eight days after the maximum of the optical curve. Ṁ is taken from (14), with the following Ṁ0: upper panel: Ṁ0 = 10-7 M⊙/year, α = 0.1. Middle panel: Ṁ0 = 3 × 10⁻⁸ M⊙/year, α = 0.3. Lower panel: Ṁ0 = 10-8 M⊙/year, α = 0.3. |
| In the text | |
|
Fig. 13 Radial dependence of the accretion rate onto the disk. The accretion rate is given in the units of the Eddington accretion rate, and R8 is given in 108 cm units. The solid line shows the initial distribution, the broken line shows the distribution of accretion rate on the disk after 40 days of evolution. Ṁ is taken from (14), with the following Ṁ0: upper panel: Ṁ0 = 10-7 M⊙/year, α = 0.1. Middle panel: Ṁ0 = 3 × 10⁻⁸ M⊙/year, α = 0.3. Lower panel: Ṁ0 = 10-8 M⊙/year, α = 0.3. |
| In the text | |
Current usage metrics show cumulative count of Article Views (full-text article views including HTML views, PDF and ePub downloads, according to the available data) and Abstracts Views on Vision4Press platform.
Data correspond to usage on the plateform after 2015. The current usage metrics is available 48-96 hours after online publication and is updated daily on week days.
Initial download of the metrics may take a while.