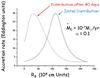
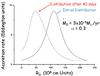
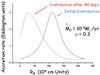
Fig. 13

Radial dependence of the accretion rate onto the disk. The accretion rate is given in the units of the Eddington accretion rate, and R8 is given in 108 cm units. The solid line shows the initial distribution, the broken line shows the distribution of accretion rate on the disk after 40 days of evolution. Ṁ is taken from (14), with the following Ṁ0: upper panel: Ṁ0 = 10-7 M⊙/year, α = 0.1. Middle panel: Ṁ0 = 3 × 10⁻⁸ M⊙/year, α = 0.3. Lower panel: Ṁ0 = 10-8 M⊙/year, α = 0.3.
Current usage metrics show cumulative count of Article Views (full-text article views including HTML views, PDF and ePub downloads, according to the available data) and Abstracts Views on Vision4Press platform.
Data correspond to usage on the plateform after 2015. The current usage metrics is available 48-96 hours after online publication and is updated daily on week days.
Initial download of the metrics may take a while.