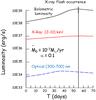
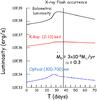
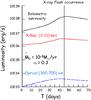
Fig. 12
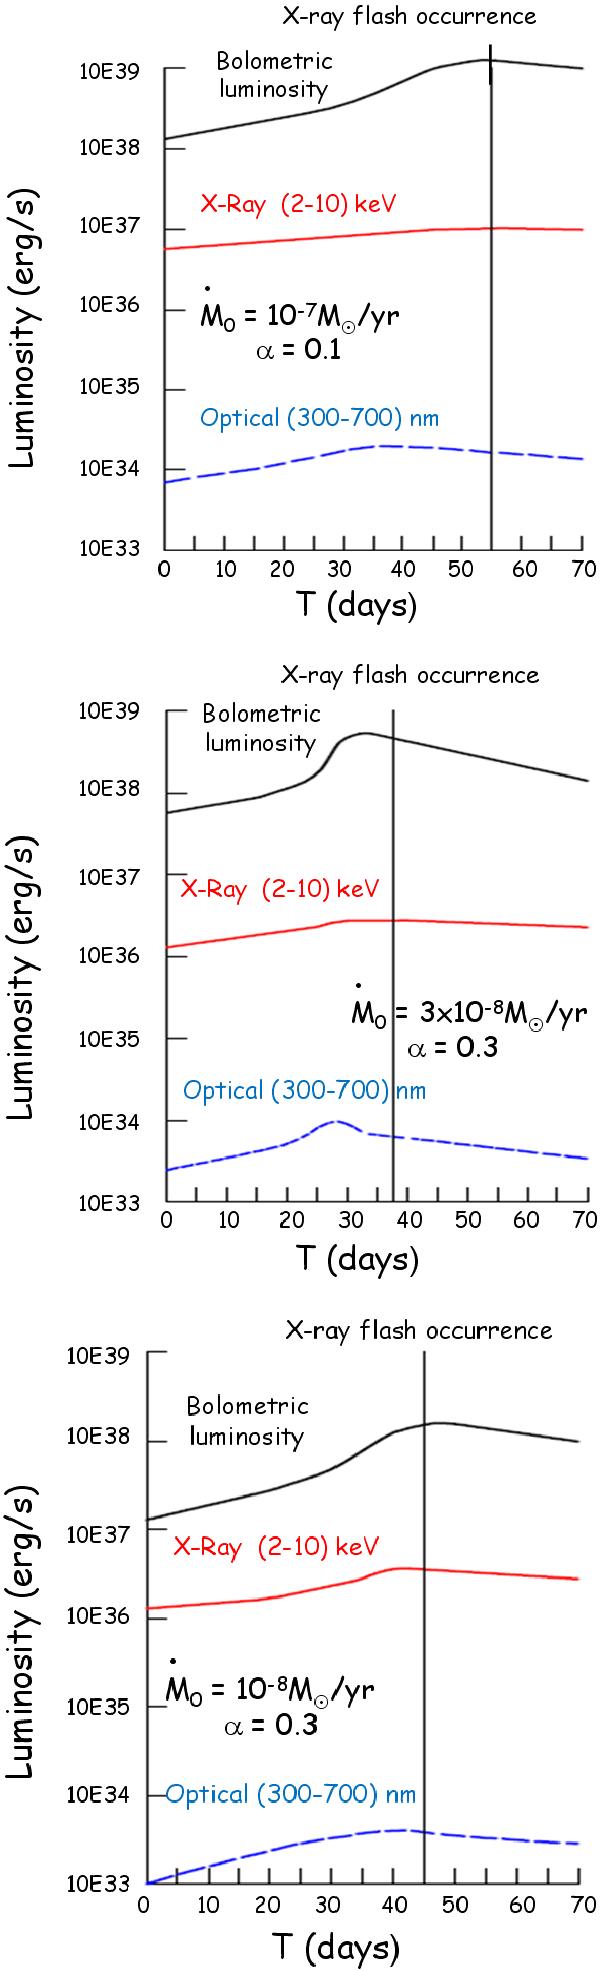
Time dependence of the: i) bolometric luminosity of the object (black line), ii) X-rays in the 2−10 keV band (red line), and iii) optical in the 300−700 nm band (broken blue line). The black vertical line marks the X-ray (2−10 keV) flash occurrence about eight days after the maximum of the optical curve. Ṁ is taken from (14), with the following Ṁ0: upper panel: Ṁ0 = 10-7 M⊙/year, α = 0.1. Middle panel: Ṁ0 = 3 × 10⁻⁸ M⊙/year, α = 0.3. Lower panel: Ṁ0 = 10-8 M⊙/year, α = 0.3.
Current usage metrics show cumulative count of Article Views (full-text article views including HTML views, PDF and ePub downloads, according to the available data) and Abstracts Views on Vision4Press platform.
Data correspond to usage on the plateform after 2015. The current usage metrics is available 48-96 hours after online publication and is updated daily on week days.
Initial download of the metrics may take a while.