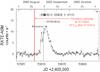
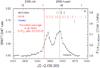
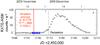
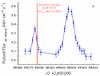
Fig. 9

From top to bottom: panel a): 2005 August–September X-ray outburst (Caballero et al. 2007); panel b): 2009 July–August X-ray outburst (Caballero et al. 2010); panel c): 2009 November–December X-ray outburst (Caballero et al. 2011). The blue stars mark Fermi GMB detections (Wilson-Hodge et al. 2009); panel d): 2010 June–August X-ray outburst (Camero-Arranz et al. 2012). The red lines mark the periastron passages at cycles 78, 91, 92, and 94 after 811205-E.
Current usage metrics show cumulative count of Article Views (full-text article views including HTML views, PDF and ePub downloads, according to the available data) and Abstracts Views on Vision4Press platform.
Data correspond to usage on the plateform after 2015. The current usage metrics is available 48-96 hours after online publication and is updated daily on week days.
Initial download of the metrics may take a while.