| Issue |
A&A
Volume 559, November 2013
|
|
|---|---|---|
| Article Number | A89 | |
| Number of page(s) | 8 | |
| Section | Cosmology (including clusters of galaxies) | |
| DOI | https://doi.org/10.1051/0004-6361/201322509 | |
| Published online | 20 November 2013 | |
Phase-space shapes of clusters and rich groups of galaxies
Dark Cosmology Centre, Niels Bohr Institute, University of Copenhagen, Juliane Maries Vej 30, 2100 Copenhagen Ø, Denmark
e-mail: wojtak@dark-cosmology.dk
Received: 20 August 2013
Accepted: 9 October 2013
Context. Clusters and groups of galaxies are highly aspherical, with shapes approximated by nearly prolate ellipsoids of revolution. An equally fundamental property is the shape of these objects in velocity space which is the anisotropy of the global velocity dispersion tensor. Although many studies address the problem of the shape in position space, there has been no attempt to measure shapes in velocity space.
Aims. Here we make use of kinematical data comprising ~600 nearby clusters and rich groups of galaxies from the Sloan Digital Sky Survey to place constraints on the phase-space shapes of these objects, i.e. their shapes in both position and velocity space.
Methods. We show that the line of sight velocity dispersion normalised by a mass-dependent velocity scale correlates with the apparent elongation, with circular (elongated) clusters exhibiting an excessive (decremental) normalised velocity dispersion. This correlation holds for dynamically young or old clusters and, therefore, it originates from projecting their intrinsic phase-space shapes rather than from dynamical evolution. It signifies that clusters are preferentially prolate not only in position space, but also in velocity space. This property allows us to break the degeneracy between oblate and prolate models and thus to deproject the apparent elongations and the line of sight velocity dispersions obtaining constraints on the axial ratios of the ellipsoids approximating cluster shapes in 3D position or velocity space.
Results. The distribution of the axial ratios in position space is found to be well approximated by a Gaussian with a mean, μ = 0.66 ± 0.01, and a dispersion, σ = 0.07 ± 0.008. The velocity ellipsoids representing the shapes in velocity space are more spherical, with a mean axial ratio of 0.78 ± 0.03.
Conclusions. The mean axial ratio of the velocity ellipsoids points to a highly anisotropic velocity distribution and, therefore, to a strong dependance of the observed velocity dispersions on the angle between the line of sight and the semi-principle axes of the clusters. This finding has important implications for mass measurements based on the line of sight velocity dispersion profiles in individual clusters. For typical axial ratios of the velocity ellipsoids in the analysed cluster sample, systematic errors on the mass estimates inferred from the line of sight velocity dispersions become comparable to statistical uncertainties for galaxy clusters with as few as 40 spectroscopic redshifts.
Key words: galaxies: clusters: general / galaxies: groups: general / galaxies: kinematics and dynamics
© ESO, 2013
1. Introduction
Clusters and rich groups of galaxies are the most massive gravitationally bound objects in the Universe. Many global properties such as luminosities, X-ray temperatures or velocity dispersions scale with the total mass of the host dark matter haloes (Popesso et al. 2005) signifying that gravitational collapse is the primary physical mechanism shaping these objects. Scaling relations emerging from this process are of great importance for using clusters as cosmological probes. Conversion between various observable properties of galaxy clusters and their masses allows one to measure the mass function and thus to constrain cosmological parameters (see e.g. Rozo et al. 2010; Rapetti et al. 2013).
There is no doubt that the halo mass is the main factor determining basic global properties of galaxy clusters. The corresponding gravitational potential well is deep enough to generate gravitational redshift of galaxies orbiting the cluster centres (Wojtak et al. 2011; Domínguez Romero et al. 2012). The halo mass alone, however, is not sufficient for modelling a number of detailed features observed in galaxy clusters, from radial profiles of different observables to complex features such as morphology or substructures. Various models based on spherically symmetric density profiles of different mass components in galaxy clusters fit most observations of undisturbed clusters reasonably well (see e.g. Biviano & Girardi 2003; Vikhlinin et al. 2006; Newman et al. 2013). They constitute a baseline for more accurate models taking asphericity of galaxy clusters into account.
Aspherical shapes of clusters and groups of galaxies is a well recognised property of these objects (Limousin et al. 2013, and references therein). The shapes can be approximated by triaxial ellipsoids which are preferentially prolate and have axial ratios of ~(0.5 − 0.8). They are commonly estimated by means of deprojecting the apparent elongations observed in optical or X-ray (see e.g. Binggeli 1982; Buote & Canizares 1996; Wang et al. 2008; Sereno et al. 2006). Combining lensing, X-ray and Sunyaev-Zel’dovich observations of individual clusters often gives more accurate estimates and additional constraints on the shape of their host dark matter haloes (see e.g. Morandi et al. 2011; Morandi & Limousin 2012; Morandi et al. 2012; Sereno et al. 2013)
Asphericity of clusters and groups of galaxies has significant impact on precise measurements of the mass distribution in individual objects (Corless et al. 2009). This is one of the main sources of systematic errors in mass measurements based on spherically symmetric models. It seems that further improvement in the cluster mass inference cannot avoid addressing this problem in a more rigorous way. Apart from this practical aspect of studies on the shapes of clusters and groups of galaxies, there is a question of its origin or relation to the cosmic web. Although the answer is not clear yet, a number of works show that galaxy groups and clusters are not randomly oriented, but rather they are aligned with the large-scale structures. This configuration is found in both observations (Paz et al. 2011) and cosmological simulations (Faltenbacher et al. 2002; Libeskind et al. 2013).
For groups and clusters observed optically, the shape describes the anisotropy of their galaxy distributions in 3D position space. It is commonly measured in terms of the axial ratios of the ellipsoids representing the moment of inertia tensor. Similar quantities can be defined in velocity space. This shape describes the anisotropy of galaxy distributions in 3D velocity space, i.e. the shape of the velocity ellipsoids representing the global velocity dispersion tensor. The shape in velocity space is not a derivative of the shape in position space, but it is complementary to it. When combined together, both quantities give insight into the phase-space shape of galaxy distributions in groups or clusters, i.e. to what degree galaxy distributions are anisotropic in position and velocity space. Although the literature is rich in measurements of the shapes in position space (see e.g. Binggeli 1982; Basilakos et al. 2000; Plionis et al. 1991, 2006; Wang et al. 2008), there is no estimate of the cluster shape in velocity space (the anisotropy of the global velocity dispersion). In this work, we make use of kinematical data of clusters and rich groups of galaxies selected from the Sloan Digital Sky Survey (SDSS; Aihara et al. 2011) to measure the shapes in both position and velocity space. The results presented here are the first constraints on the full phase-space shapes of clusters and groups of galaxies.
The manuscript is organised as follows. In Sect. 2, we describe the galaxy clusters and groups selected for this work as well as all observables used in the analysis. In Sect. 3, we show how the measurements of the line of sight velocity dispersions combined with the apparent elongations can be used to discriminate between prolate and oblate models describing the phase-space shapes of groups and clusters. The main data analysis follows in Sects. 4 and 5, in which we measure the axial ratios of the ellipsoids representing the shapes of groups and clusters in position or velocity space. Section 6 includes the summary and conclusions.
2. Data
We make use of the catalogue of galaxy groups generated by Yang et al. (2007). The catalogue contains galaxy groups and members of the groups found with the hierarchical friends-of-friends (FOF) algorithm applied to the SDSS data. Its current up-to-date version is based on the 8th data release, DR8 (Aihara et al. 2011). For the purpose of our analysis, we select 574 clusters and groups of galaxies containing at least 20 members with spectroscopic redshifts.
The catalogue provides the total mass estimates of the groups based on abundance matching. The mass estimates are normalised to a fixed overdensity equal to 43ρc, where ρc is the critical density at the present time. Throughout the paper, we keep the same definition of the group mass based on the same overdensity parameter. The assumed overdensity threshold is approximately 2 times smaller than typical virial overdensity in a ΛCDM cosmology, which is approximately equal to 100ρc (Bryan & Norman 1998). This implies that the mass corresponding to the assumed overdensity is typically 30 per cent larger than the commonly used virial mass.
The overdensity parameter assumed in the catalogue sets also a threshold for the projected phase-space density of galaxies selected as the group members (the density in the space of redshifts and the positions on the sky). This implies that typically 20 per cent of the members populate a part of the infall zone extending to the projected distances which are 50 per cent larger than the virial radius. A comparable fraction of cluster members happens to be found at distances up to 2 virial radii due to a projection effect that affects all methods of the member selection (Wojtak et al. 2007). Therefore, it seems that a lower phase-space density threshold adopted by Yang et al. (2007) leads to a more balanced completeness along the sight line and in the plane of the sky than the commonly used virial overdensity, i.e. the maximum projected radii of the group members are comparable to the maximum line of sight distances resulting from the projection effect.
Halo masses of the selected groups, as estimated from abundance matching, span the range from 2 × 10¹³ h-1M⊙ to 5 × 10¹⁴ h-1M⊙ (95 per cent range). The quartiles equal to log 10Mhalo [h-1M⊙] = 13.7, 14.0, 14.2. The sample comprises both clusters and rich groups of galaxies. For the sake of simplicity, hereinafter we refer to all selected objects as clusters.
The mass estimates from the catalogue are directly based on optical luminosities. Since the selection of cluster members does not explicitly depend on spherical symmetry, we expect that the luminosities and, therefore, the final mass estimates are not sensitive to the apparent shapes of the clusters (the same luminosities are expected for circular or elongated clusters with the same halo masses). In order to test this, we split the sample into equally-sized subsamples comprising circular and elongated clusters. If the mass estimates are independent of the elongations, one should expect the same mass distributions and mass-luminosity relations in both subsamples. Performing a K-S test we checked that the probability distributions underlying the two mass subsamples are the same (the null hypothesis that the distributions are the same cannot be rejected at the confidence level of 20 per cent). We also checked that the luminosity-mass relations in the two cluster subsamples are fully consistent with each other. These two simple tests rule out any significant dependance of the mass estimates on the apparent shapes of the clusters.
For every cluster, we measure the projected velocity dispersion σlos using a standard unbiased estimator for the variance, i.e.  (1)where vi are the line of sight velocities in the cluster rest frame and
  is the mean. We also assign standard sampling errors given by σlos /
 .
.
Using the positions of the cluster members on the sky, we calculate the shape tensor  (2)where (r1,k,r2,k) are the local Cartesian coordinates of kth galaxy on the sky and N is the number of members in a cluster. The coordinates are measured with respect to the cluster centre approximated by the mean position of all members. For calculating the mean position, we assign equal weights to all galaxies. We checked that weighting by luminosity does not change the final results of this work. By diagonalising the shape tensor, we calculate the semi-principle axes of the ellipses approximating the apparent shapes of the clusters. The semi-major and semi-minor axes are given by
  and
and  , where λ1,2 are the eigenvalues of the shape tensor in increasing order. Finally, we quantify the shape of every cluster by computing the axial ratio (or the apparent elongation) q2D = c2D/a2D. The errors on the apparent elongation are calculated by bootstrapping subsamples of galaxies from every cluster.
3. Prolate or oblate?
In the first order approximation, the 3D shapes of clusters may be described by ellipsoids of revolution. Inferring the 3D shape ellipsoids from the observed axial ratios is difficult and always ends up with a degeneracy between prolate and oblate models. Here we show that combining measurements of the apparent axial ratios with the velocity dispersions allows one to break this degeneracy and to discriminate between prolate and oblate shape ellipsoids in a less ambiguous way.
The method relies on a very general argument that the velocity dispersion observed along the semi-major axis is larger than that along the semi-minor axis. This property may be easily shown using the tensor virial theorem, although it is more general than all physical configurations permitted by this theorem. According to the theorem, the ratio of the corresponding diagonal elements of the kinetic and potential energy tensors calculated along the semi-principle axes are equal to − 2. Since the element of the potential energy tensor associated with the semi-major axis is the largest, one expects that the sight line aligned with this axis maximises the observed velocity dispersion. This effect is well exhibited by simulated dark matter haloes as the alignment of the halo shape ellipsoids and the velocity ellipsoids – geometrical representation of the velocity dispersion tensor (Kasun & Evrard 2005; Wojtak et al. 2013).
The alignment of the semi-principle axes of the velocity dispersion tensor and the shape tensor leads to different observational signatures for populations of prolate or oblate galaxy clusters. The relative excess of the velocity dispersion is expected to occur in prolate clusters observed along their semi-major axis or in oblate clusters observed in the plane of two degenerate semi-major axes. Considering a sample of clusters observed along random sight lines, one can expect that the excess of the observed velocity dispersion should increase with the apparent elongation, when observing prolate clusters, or decrease with increasing elongation, when observing oblates clusters. Thus the problem of discriminating between prolate and oblate models is reduced to a test of correlation/anticorrelation between the line of sight velocity dispersion σlos and the apparent elongation q2D. It is worth emphasising that prolate/oblate models characterise the shapes in both position and velocity space.
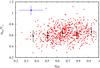 |
Fig. 1 Line of sight velocity dispersion in 574 clusters and rich groups of galaxies as a function of the apparent elongation q2D. The blue error bars show the mean 68 per cent uncertainties of the measurements. The black points show the mean and the 68 per cent scatter of the dispersions in 5 bins of the elongation. The velocity dispersions are scaled by the characteristic velocity Vc which is a measure of the gravitational potential depth of the host dark matter haloes. The figure shows that circular clusters exhibit higher normalised line of sight velocity dispersions than elongated ones. |
The velocity dispersion is primarily correlated with the halo mass. In order to remove the dependance on the halo mass, we normalise the dispersions by the characteristic velocity  , where
  is the halo mass from the group catalogue. The halo masses are estimated from abundance matching and, therefore, they are not explicitly related to the velocity dispersions. Thus the characteristic velocity Vc sets the scale of the potential that is independent of the observed velocities of galaxies in the clusters. This means that scaling by Vc removes the dependance on mass (or the depth of the gravitational potential well), but preserves a key relation between excess/decrement of the velocity dispersion and the apparent elongation.
Figure 1 shows the normalised line of sight velocity dispersions and the apparent elongations, q2D, of the clusters. For the sake of readability, we do not plot the errors of every single measurement, but instead we show the mean 68 per cent uncertainties resulting from averaging over all measurements (the blue error bars). The black points show the mean and the 68 per cent scatter of the dispersions in 5 bins of elongation. A visible trend of the mean increasing with q2D may point to a correlation between σlos/Vc and q2D. The measured scatter of data points exceeds the mean statistical uncertainty in σlos/Vc by 17 per cent. This signifies the existence of an intrinsic scatter in the normalised velocity dispersions. As we show later, this scatter can be ascribed to differences in the concentration of dark matter haloes. This scatter is comparable to the statistical uncertainties of the measurements and needs to be taken into account in quantifying the statistical significance of a plausible σlos/Vc − q2D correlation.
In order to estimate statistical significance of the correlation between the normalised line of sight velocity dispersion, σlos/Vc, and the apparent elongation, q2D, we measure the slope of a linear relation between them. Linear fitting is carried out assuming the following likelihood function ![\begin{eqnarray} L(a,b,\sigma_{0}) & \propto & \prod \frac{1}{\sqrt{2\pi (\sigma_{i}^{2}+\sigma_{0}^{2})}} \nonumber \\ & & \exp\Big(-\frac{[(\sigma_{\rm los}/V_{\rm c})_{i}-b-aq_{\rm 2D}]^{2}}{2(\sigma_{i}^{2}+\sigma_{0}^{2})}\Big), \end{eqnarray}](/articles/aa/full_html/2013/11/aa22509-13/aa22509-13-eq44.png) (3)where σi is the statistical uncertainty on (σlos/Vc)i, σ0 is the intrinsic scatter (assumed to be a free parameter), a and b are the slope and the intercept of a linear model, both free parameters.
(3)where σi is the statistical uncertainty on (σlos/Vc)i, σ0 is the intrinsic scatter (assumed to be a free parameter), a and b are the slope and the intercept of a linear model, both free parameters.
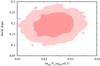 |
Fig. 2 Coefficients of a linear relation between the normalised line of sight velocity dispersion, σlos/Vc, and the apparent elongation, q2D, of the clusters. The shaded regions show the 68 and 95 per cent confidence contours of the posterior probability distribution marginalised over the intrinsic scatter in σlos/Vc. A positive slope signifies a correlation between the normalised line of sight velocity dispersion and the apparent elongation, consistent with prolate cluster shapes both in 3D position and 3D velocity space. |
Constraints on the three parameters are obtained using a Markov chain Monte Carlo (MCMC) approach with the Metropolis-Hastings algorithm. In order to minimise a correlation between the slope and the intercept, we measure q2D with respect to the median equal to 0.7. Figure 2 shows the resulting constraints on the slope and the intercept marginalised over the intrinsic scatter. The 1σ intervals of the parameters are 0.19 ± 0.04 for the slope, 0.624 ± 0.05 for the intercept and 0.096 ± 0.004 for the intrinsic scatter. The analysis excludes a negative slope (anticorrelation) at the >10-4 confidence level. We interpret this result as a strong observational signature of preferentially prolate shapes of the clusters.
The measurement of the line of sight velocity dispersion depends in general on which galaxies are selected as the cluster members. Since galaxy clusters tend to be aligned with the large-scale structures, one may suspect that the bias in the line of sight velocity dispersion, due to the background/foreground galaxies misidentified as the cluster members, may depend on the cluster orientation with respect to the line of sight. The presence of this kind of bias can be easily verified by measuring the fraction of blue galaxies as a function of the apparent elongation: clusters aligned with the line of sight are expected to be more contaminated by blue galaxies from the large-scale structures than those oriented perpendicularly to the line of sight. Closer inspection of the photometric data does not reveal any trend between the fraction of blue galaxies identified by g − r colour (see more details about the colour selection in Sect. 3.1) and the apparent elongation, i.e. the mean fraction of blue galaxies is the same in all bins of the apparent elongations. Therefore, we conclude that it is unlikely that the observed relation between the normalised line of sight velocity dispersion and the apparent elongation could result from large-scale structures aligned with galaxy clusters.
3.1. Effect of dynamical state
Statistically significant correlation between the normalised line of sight velocity dispersion and the apparent shapes of the clusters is consistent with a simple geometrical model in which the correlation emerges from projecting the cluster shapes which are approximated by prolate ellipsoids of revolution. It was suggested in several studies that the observed correlation may also be a signature of dynamical evolution of clusters (see e.g. Tovmassian & Plionis 2009; Ragone-Figueroa et al. 2010). This interpretation was supported by some observed trends of the apparent elongation and velocity dispersion with the fraction of early-type galaxies and compactness of galaxy groups: groups with late formation times (dynamically young) appear to have larger elongations, smaller dispersions, smaller concentrations of galaxies and smaller fractions of early-type galaxies.
In order to check what is the impact of this scenario on the geometrical interpretation of the σlos/Vc − q2D correlation, we split the sample into dynamically young (later formation times) and dynamically old (earlier formation times) clusters. We use two independent diagnostics of dynamical state which are independent of kinematical data: the fraction of early-type galaxies and the luminosity gap between the first- and second-ranked galaxies in the g band. Dynamically old (relaxed) clusters tend to have higher fractions of elliptical galaxies as a result of dynamically-driven transformation of morphological types (Butcher & Oemler 1978, 1984; Goto 2005) and larger magnitude gaps of two brightest galaxies (see e.g. Dariush et al. 2007; Smith et al. 2010). Early and late type galaxies are identified by g − r colour. We adopt the same boundary line separating red and blues galaxies as Yang et al. (2007; see also van den Bosch et al. 2008), i.e. ![\begin{equation} (g-r)_{z\,=\,0.1}=0.76+0.15[\log_{10}(M_{\ast}h^2/\Msun)-10], \end{equation}](/articles/aa/full_html/2013/11/aa22509-13/aa22509-13-eq59.png) (4)where M∗ is the stellar mass estimated using the relation between the stellar mass-to-light ratio and colour of Bell et al. (2003).
(4)where M∗ is the stellar mass estimated using the relation between the stellar mass-to-light ratio and colour of Bell et al. (2003).
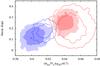 |
Fig. 3 Effect of dynamical state of clusters on the coefficients of a linear relation between the normalised line of sight velocity dispersion, σlos/Vc, and the apparent elongation, q2D, inferred from the galaxy distribution on the sky. The red contours, with (σlos/Vc)(q2D = 0.7) ≳ 0.625, show constraints for dynamically old clusters and the blue ones, with (σlos/Vc)(q2D = 0.7) ≲ 0.625, for dynamically young. The filled and empty contours correspond to the clusters selected by the fraction of red galaxies and by the magnitude gap of the two brightest galaxies, respectively. The contours show the 68 and 95 per cent confidence regions of the posterior probability distribution marginalised over the intrinsic scatter in σlos/Vc. Clusters at different dynamical states exhibit consistently a correlation between the normalised line of sight dispersion and the apparent elongation. |
We repeat fitting a linear model to the velocity dispersions and the apparent elongations of dynamically old and young clusters. The cluster sample is split into young and old systems using the median value of the fraction of early-type galaxies, 0.71, and the magnitude gap of 0.8. The old clusters appear to have larger σlos/Vc than the young ones (see Fig. 3). On the other hand, constraints on the slope of the σlos/Vc − q2D relation do not show any differences between the two cluster samples. Both the old and young clusters exhibit a strong correlation between σlos/Vc and q2D.
The obtained constraints on the linear coefficients signify that the effect of dynamical state manifests itself only as a modulation of the σlos/Vc − q2D correlation, but not as the correlation itself. We note that a similar modulation of the σlos/Vc − q2D relation was shown by Ragone-Figueroa et al. (2010) who used a compactness of galaxy groups as a diagnostic of their dynamical state. As an additional consistency test, we also checked that the modulation does not occur when splitting the cluster sample by mass, i.e. constraints on the slope and the intercept in four equally-sized bins of the halo mass are statistically the same. This simple test shows that scaling by Vc removes effectively the dependance on halo mass.
Having shown that the effect of dynamical evolution gives rise to the modulation in the intercept of the σlos/Vc − q2D relation, we conclude that the correlation itself originates from projecting the 3D shapes of clusters and it should be considered a strong observational signature of clusters being preferentially prolate objects. This conclusion is in line with a number of works studying the same problem with different methods and using different kinematical data of groups and clusters of galaxies (see e.g. Basilakos et al. 2000; Paz et al. 2006; Plionis et al. 2006; Sereno et al. 2006; Wang et al. 2008; Limousin et al. 2013, and references therein). Compered to these results, however, our conclusions go further. Prolate shapes of galaxy clusters are expected not only in position space, but also in velocity space, i.e. both the 3D shape and the velocity dispersion tensor can be represented geometrically by coaligned prolate ellipsoids of revolution. This feature reduces considerably the family of all possible models describing the phase-space shapes of the clusters. It allows us to break the prolate-oblate degeneracy and thus to deproject the apparent elongations and the line of sight velocity dispersions.
4. Shape in position space
Here we reconstruct the 3D shapes of the clusters by means of deprojecting the apparent elongations q2D. Deprojection is unambiguous if one reduces the domain of all permitted solutions to prolate or oblate ellipsoids. Following our reasoning presented in the previous section, we assume prolateness of the shape ellipsoids, in consistency with the observed σlos/Vc − q2D correlation.
For a population of clusters with the same 3D shape, observed along random sight lines, the apparent elongation q2D (apparent axial ratio) occurs with the following probability 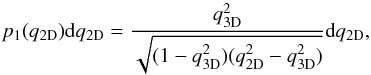 (5)where
  is the true axial ratio of the shape ellipsoids in 3D space. More realistic models of the cluster shapes should account for an intrinsic distribution of q3D within the population. In this case, the probability distribution of the apparent elongation becomes a convolution of the probability (5) with the intrinsic distribution of the axial ratio q3D. We approximate the latter by a Gaussian with a mean μq3D and a dispersion σq3D. In order to conform to the allowed range of values, the Guassian is truncated at q3D = 0 and q3D = 1.
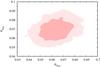 |
Fig. 4 Mean, μq3D, and dispersion, σq3D, of the axial ratios of prolate ellipsoids approximating the 3D shapes of galaxy clusters. The contours show the 68 and 95 per cent confidence regions of the posterior probability. |
The errors on q2D are highly heterogenous and nearly comparable to the scatter resulting from the intrinsic distribution of q3D. This feature needs to be taken into account in a robust measurement of μ3D and σ3D. We incorporate the statistical uncertainties on q2D by convolving the model probability distribution pmodel (the probability (5) convolved with a Gaussian G(μq3D,σq3D)) with the probability distribution Gerrori describing constraints on the apparent elongation in consecutive clusters labeled by i. The corresponding likelihood function takes the following form ![\begin{equation} L \propto \prod_{i} \left[p_{\rm model}(\mu_{\rm 3D},\sigma_{\rm 3D})\ast G_{\rm error\;i}\right], \label{like} \end{equation}](/articles/aa/full_html/2013/11/aa22509-13/aa22509-13-eq79.png) (6)where ∗ indicates a convolution. We approximate Gerrori by a Gaussian with the maximum at q2Di and the dispersion equal to the error estimated from bootstrapping. The Gaussian is truncated at q2D = 0 and q2D = 1 and normalised to 1 in the range
(6)where ∗ indicates a convolution. We approximate Gerrori by a Gaussian with the maximum at q2Di and the dispersion equal to the error estimated from bootstrapping. The Gaussian is truncated at q2D = 0 and q2D = 1 and normalised to 1 in the range  .
.
Figure 4 shows constraints on the mean, μq3D, and the dispersion, σq3D, of the 3D axial ratios, q3D, of the shape ellipsoids. The analysis was carried out using the MCMC technique. The best-fit values of the parameters are μq3D = 0.664 ± 0.010 and  . We checked that the constraints do not change when using subsamples of dynamically old or young clusters.
Our constraints on the 3D shapes of galaxy clusters are consistent with an independent measurement based on an earlier version of the catalogue by Yang et al. (2007), generated from SDSS DR4. A Monte Carlo deprojection of the apparent shapes carried out by Wang et al. (2008) yield the mean axial ratio of around 0.6 for groups with halo masses comparable to those from our sample and having at least 10 members. Comparison with other results from the literature is less straightforward due to a number of differences between various measurements, e.g. the selection clusters or member galaxies. Neglecting all these differences, we find that most measurements of the shapes inferred from galaxy positions in clusters and massive groups point to a mean axial ratio of ~(0.5 − 0.6) and an intrinsic scatter of ~0.15 (Binggeli 1982; Plionis et al. 1991; de Theije et al. 1995; Basilakos et al. 2000). Our results are fully compatible with these findings, although slightly larger mean and smaller scatter is preferred.
It is interesting to compare our results with the shapes of simulated dark matter haloes. Although the literature is rich in studies addressing this problem, such comparison is not straightforward, mostly because of different ways of measuring this property. However, selecting results which are based on a consistently similar working definition of the shape (given by the eigenvalues of the shape tensor calculated within the virial sphere of ~1014 h-1M⊙ haloes), we find that the axial ratios (averaged over the minor-to-major and medium-to-major axis ratios) are typically in the range from ~0.6 to ~0.7 (see e.g. Bullock 2002; Bailin & Steinmetz 2005; Kasun & Evrard 2005; Allgood et al. 2006; Bett et al. 2007; Gottlöber & Yepes 2007). The measured axial ratios of the cluster shape ellipsoids, q3D ~ 0.66 ± 0.07, happen to lie within this range.
5. Shape in velocity space
The distribution of the normalised line of sight velocity dispersion is partially determined by the shape of clusters in 3D velocity space, i.e. the anisotropy of the velocity dispersion tensor. Therefore, it can be used to place constraints on the anisotropy of the velocity dispersion quantified in terms of the ratio of the velocity dispersion along the semi-major axis, σmaj, to the velocity dispersion along the semi-minor axis, σmin. This novel idea is conceptually similar to a well-known technique of shape deprojection, but applied to the line of sight velocity dispersions instead of the apparent shapes on the sky.
Considering a population of clusters with the same anisotropy of the velocity dispersion tensor (the same axis ratios qv = σmin/σmaj of the velocity ellipsoids), one can show that the normalised velocity dispersion  along a random sight line is observed with a probability given by
 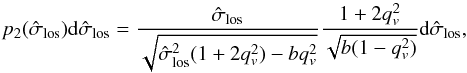 (7)where b is a bias parameter defining the ratio of the total velocity dispersion to the characteristic velocity Vc in the following way:
 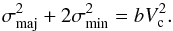 (8)From an argument of self-similar dynamics of galaxy clusters, one expects that b should take comparable values for all clusters in the sample. The exact value of the bias parameter relies on the definition of Vc and on how this velocity scale is related to the cluster dynamics. Needles to say, one should expect b to be around 1 if Vc is the circular velocity on the scale comparable to the virial overdensity. In particular, for a spherical cluster in dynamical equilibrium, with galaxies and dark matter distributed according to the NFW density profile (Navarro et al. 1997) with the concentration parameter c = 5 (for the overdensity 200ρc; see Prada et al. 2012) and with isotropic orbits, one expects b ≈ 1.2 when Vc is the virial velocity. In general, the theoretical prediction for the bias is rather not precise enough. Therefore, b is assumed to be a free parameter in the analysis.
 |
Fig. 5 Position of the maximum, μq3D, and dispersion, σq3D, of a Gaussian approximating the distribution of the axial ratios qv = σmin/σmaj of prolate velocity ellipsoids representing the velocity dispersion tensor. The contours show the 68 and 95 per cent confidence regions of the posterior probability distribution marginalised over the bias parameter |

The remaining steps of the analysis are quite similar to the previous section. We assume that the intrinsic distribution of the axial ratio qv = σmin/σmaj is given by a Gaussian distribution with the maximum positioned at μqv and the dispersion σqv. The Gaussian is truncated at qv = 0,1 and normalised to 1 in the range  . Its convolution with the probability distribution (7) gives the final probability distribution of the observed σlos/Vc, i.e. pmodel in the likelihood function (6). Analogous to the shape deprojection, we use the likelihood given by (6) with Gerrori approximated by Gaussian. In this case however, the total dispersion δi of Gerrori includes both the contributions from the statistical uncertainties on σlos and the errors on Vc resulting from a conversion between the luminosity and the cluster total mass:
 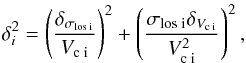 (9)where δσlosi is the sampling error of the dispersion estimator and δVci/Vci is the relative accuracy in the estimate of Vci for ith cluster. Typical relative error on the mass estimate from the mass-luminosity relation for galaxy clusters is estimated at δM/M ≈ 0.45 (Popesso et al. 2005). Propagating this error to the characteristic velocity Vc yields δVci/Vci = (1/3)(δMi/Mi) ≈ 0.15, which is the value adopted for the analysis.
As per the analysis of the cluster shapes in position space, we fit the model using the MCMC technique. Figure 5 shows the resulting posterior probability distribution marginalised over the bias parameter. Constraints on μqv and σqv are noticeably worse than for their counterparts in position space. This is not surprising, because this analysis attempts to recover 3D information from 1D data (σlos) which is a more complex problem than deprojecting 2D elongations (q2D). Another feature displayed in Fig. 5 is a degeneracy between narrow Gaussians with smaller μqv and wider Gaussians with larger μqv.
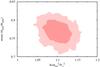 |
Fig. 6 Bias parameter, |
Due to the fact that the distribution of qv is restricted to the range , and that the dispersion is comparable to the location of the maximum, μqvis not equal to the mean of the intrinsic distribution. Interestingly, the axis of degeneracy seen in Fig. 5 is approximately parallel to the lines of equal mean values. Therefore, it is tempting to marginalise the posterior probability distribution along the lines of constant mean values and thus to place tighter constraints on the mean axial ratio of the velocity ellipsoids. The resulting probability distribution is shown in Fig. 6. The mean axial ratio of the velocity ellipsoids equals to  signifying highly anisotropic velocity distributions of galaxies in the selected groups and clusters. This measurement happens to be compatible with typical values of the anisotropy of the global velocity dispersion tensor found in simulated dark matter haloes (Kasun & Evrard 2005; Wojtak et al. 2013). We note that this approach to quantifying the degree of symmetry of the velocity distribution in galaxy clusters relies on more general reasoning than commonly used methods based on measuring the ratio of the radial-to-tangential velocity dispersions (see e.g. Biviano & Katgert 2004; Hwang & Lee 2008; Wojtak & Łokas 2010). Reasoning about isotropy or anisotropy based on the radial-to-tangential velocity dispersion requires an assumption of spherical symmetry which is in contradiction with the observed shapes of groups and clusters.
We repeat the above analysis using subsamples of dynamically young and old clusters. The only unambiguous and statistically significant difference between the two subsamples occurs in constraints on the bias parameter (see Fig. 7). Dynamically old clusters appear to have higher bias parameters ( for clusters dominated by red galaxies and
  for clusters with large magnitude gaps) than young ones (b = 1.04 ± 0.03 for clusters less dominated by red galaxies and
  for clusters with small magnitude gaps). This trend in the bias parameter results mainly from not taking the concentration of the dark matter distribution into account in the definition of the characteristic velocity Vc. As a consequence of this, Vc is relatively smaller or bigger than the gravitational potential depth of dynamically young (with low-concentration haloes) or old (with high-concentration haloes) clusters, respectively. For a self-similar phase-space distribution of galaxies in clusters, this leads to a respectively higher or lower bias parameter, in proportion to the gravitational potential depths in the two cluster subsamples. A simple estimate of this effect can be made using an NFW gravitational potential (Navarro et al. 1997; Łokas & Mamon 2001). The mean concentration parameters c of ~1014 h-1M⊙ haloes lying above or below the mean mass-concentration relation are estimated at c ≈ 7.6 and c ≈ 4.7, respectively (with the virial overdensity 95ρc; see Macciò et al. 2008). This leads to the relative difference between the potential depths of 17 per cent, in agreement with the relative change of the bias parameter between dynamically old and young clusters. In general, constraints on the bias parameter lie very close to a simple theoretical estimate based on an isotropic Jeans equation, b = 1.2. The bias parameter inferred from an analysis combining both the old and young clusters amounts to
  .
.
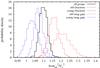 |
Fig. 7 Bias parameter |
6. Summary and conclusions
We analysed galaxy kinematics in 574 clusters and rich groups of galaxies selected from the SDSS. We showed that the line of sight velocity dispersion normalised by a mass-dependent velocity scale correlates with the apparent elongation of the clusters (higher velocity dispersion for more circular clusters). The correlation holds for dynamically young and old clusters (selected by the magnitude gap between two brightest galaxies or by the fraction of red galaxies) which signifies that it originates from the intrinsic anisotropy of galaxy distributions in phase space rather than from dynamical evolution. The sign of the correlation is consistent with prolate shapes of the clusters in both position and velocity space, i.e. the shape and velocity ellipsoids representing the moment of inertia and the velocity dispersion tensor are approximated by coaligned prolate ellipsoids of revolution. This property allowed us to deproject the apparent elongations and the line of sight velocity dispersion and thus to place constraints on the axial ratio of the shape and velocity ellipsoids.
Groups and clusters appear to be highly aspherical in both position and velocity space. Velocity ellipsoids with a mean axial ratio of 0.78 are more spherical than shape ellipsoids which have typical axial ratios of 0.66. Constraints on the shape ellipsoids complement consistently a number of previous measurements based on similar studies of galaxy positions in groups and clusters (see e.g. Binggeli 1982; Plionis et al. 1991; de Theije et al. 1995; Basilakos et al. 2000; Wang et al. 2008).
In our work we present the first estimate of asphericity of galaxy velocity distributions in clusters and rich groups, i.e. the degree of departure from spherical symmetry. Both the measurement and the reasoning are more general than a common approach based on estimating the so-called  (see e.g. Biviano & Katgert 2004; Hwang & Lee 2008; Wojtak & Łokas 2010), which is incapable of assessing the symmetry of velocity field, because it implicitly assumes spherical symmetry.
The constrains on the shape of velocity ellipsoids point to highly anisotropic velocity distributions. When expressed in the same scale as the β parameter, the mean anisotropy of the global velocity dispersion tensor equals to  . The total velocity dispersion normalised by the circular velocity based on the overdensity mass is higher for dynamically old clusters than for dynamically young ones. We ascribe this effect to differences in the concentration of the mass distribution between clusters at different states of dynamical evolution.
Highly anisotropic velocity distributions of galaxies in clusters and rich groups have important impacts on inferring halo masses or mass profiles from the observed line of sight velocity dispersions. Due to the unknown angle between the sight line and the principal axes of the velocity ellipsoids, the anisotropy becomes inevitably a major source of systematic errors. For the mean anisotropy of the velocity dispersion tensors, σmin/σmaj = 0.78, the expected systematic error describing the deviation of the observed line of sight dispersion from the dispersion averaged over random sight lines amounts to 11 per cent. This error becomes comparable to the statistical uncertainty on the line of sight velocity dispersion for clusters with as few as 40 spectroscopic redshifts. For rich clusters with more than ~100 redshifts, the unknown projection of the velocity ellipsoid is expected to be one of the major sources of systematic errors in an analysis assuming spherical symmetry. This questions the relevance of increasing the complexity of dynamical models based on spherically symmetric phase-space density models. We expect that further improvement in constraining the mass profiles from kinematics of galaxies in clusters or rich groups should rely on proper modelling of asphericity rather then expanding degrees of freedom of spherical models. It is also worth noting that the number of spectroscopic redshifts available for some rich galaxy clusters, such as Abell 1689 (Lemze et al. 2009), is large enough to constrain the phase-space shapes of individual galaxy clusters. Our finding is also a caution for studying kinematics in such objects as dwarf spheroidals, for which the apparent elongations may likely be a signature of anisotropic velocity distributions and thus point to a limited applicability of spherically symmetric dynamical models (see also Kowalczyk et al. 2013).
Acknowledgments
The author is grateful to William Watson for critical reading of the manuscript. He also thanks Gary A. Mamon, Anja von der Linden and Andrea Biviano for fruitful discussions, and the anonymous referee for insightful comments. The Dark Cosmology Centre is funded by the Danish National Research Foundation.
References
- Aihara, H., Allen de Prieto, C., An, D., et al. 2011, ApJS, 193, 29 [NASA ADS] [CrossRef] [Google Scholar]
- Allgood, B., Flores, R. A., Primack, J. R., et al. 2006, MNRAS, 367, 1781 [NASA ADS] [CrossRef] [Google Scholar]
- Bailin, J., & Steinmetz, M. 2005, ApJ, 627, 647 [Google Scholar]
- Basilakos, S., Plionis, M., & Maddox, S. J. 2000, MNRAS, 316, 779 [NASA ADS] [CrossRef] [Google Scholar]
- Bell, E. F., McIntosh, D. H., Katz, N., & Weinberg, M. D. 2003, ApJS, 149, 289 [NASA ADS] [CrossRef] [Google Scholar]
- Bett, P., Eke, V., Frenk, C. S., et al. 2007, MNRAS, 376, 215 [NASA ADS] [CrossRef] [Google Scholar]
- Binggeli, B. 1982, A&A, 107, 338 [NASA ADS] [Google Scholar]
- Biviano, A., & Girardi, M. 2003, ApJ, 585, 205 [NASA ADS] [CrossRef] [Google Scholar]
- Biviano, A., & Katgert, P. 2004, A&A, 424, 779 [NASA ADS] [CrossRef] [EDP Sciences] [Google Scholar]
- Bryan, G. L., & Norman, M. L. 1998, ApJ, 495, 80 [NASA ADS] [CrossRef] [Google Scholar]
- Bullock, J. S. 2002, in The Shapes of Galaxies and their Dark Halos, ed. P. Natarajan (World Scientific Publishing), 109 [Google Scholar]
- Buote, D. A., & Canizares, C. R. 1996, ApJ, 457, 565 [NASA ADS] [CrossRef] [Google Scholar]
- Butcher, H., & Oemler, Jr., A. 1978, ApJ, 219, 18 [NASA ADS] [CrossRef] [Google Scholar]
- Butcher, H., & Oemler, Jr., A. 1984, ApJ, 285, 426 [NASA ADS] [CrossRef] [Google Scholar]
- Corless, V. L., King, L. J., & Clowe, D. 2009, MNRAS, 393, 1235 [NASA ADS] [CrossRef] [Google Scholar]
- Dariush, A., Khosroshahi, H. G., Ponman, T. J., et al. 2007, MNRAS, 382, 433 [NASA ADS] [CrossRef] [Google Scholar]
- de Theije, P. A. M., Katgert, P., & van Kampen, E. 1995, MNRAS, 273, 30 [NASA ADS] [Google Scholar]
- Domínguez Romero, M. J. d. L., García Lambas, D., & Muriel, H. 2012, MNRAS, 427, L6 [NASA ADS] [CrossRef] [Google Scholar]
- Faltenbacher, A., Gottlöber, S., Kerscher, M., & Müller, V. 2002, A&A, 395, 1 [NASA ADS] [CrossRef] [EDP Sciences] [Google Scholar]
- Goto, T. 2005, MNRAS, 359, 1415 [NASA ADS] [CrossRef] [Google Scholar]
- Gottlöber, S., & Yepes, G. 2007, ApJ, 664, 117 [NASA ADS] [CrossRef] [Google Scholar]
- Hwang, H. S., & Lee, M. G. 2008, ApJ, 676, 218 [NASA ADS] [CrossRef] [Google Scholar]
- Kasun, S. F., & Evrard, A. E. 2005, ApJ, 629, 781 [NASA ADS] [CrossRef] [Google Scholar]
- Kowalczyk, K., Łokas, E. L., Kazantzidis, S., & Mayer, L. 2013, MNRAS, 431, 2796 [NASA ADS] [CrossRef] [Google Scholar]
- Lemze, D., Broadhurst, T., Rephaeli, Y., Barkana, R., & Umetsu, K. 2009, ApJ, 701, 1336 [NASA ADS] [CrossRef] [Google Scholar]
- Libeskind, N. I., Hoffman, Y., Forero-Romero, J., et al. 2013, MNRAS, 428, 2489 [NASA ADS] [CrossRef] [Google Scholar]
- Limousin, M., Morandi, A., Sereno, M., et al. 2013, Space Sci. Rev., 177, 155 [NASA ADS] [CrossRef] [Google Scholar]
- Łokas, E. L., & Mamon, G. A. 2001, MNRAS, 321, 155 [NASA ADS] [CrossRef] [Google Scholar]
- Macciò, A. V., Dutton, A. A., & van den Bosch, F. C. 2008, MNRAS, 391, 1940 [NASA ADS] [CrossRef] [Google Scholar]
- Morandi, A., & Limousin, M. 2012, MNRAS, 421, 3147 [NASA ADS] [CrossRef] [Google Scholar]
- Morandi, A., Limousin, M., Rephaeli, Y., et al. 2011, MNRAS, 416, 2567 [NASA ADS] [CrossRef] [Google Scholar]
- Morandi, A., Limousin, M., Sayers, J., et al. 2012, MNRAS, 425, 2069 [NASA ADS] [CrossRef] [Google Scholar]
- Navarro, J. F., Frenk, C. S., & White, S. D. M. 1997, ApJ, 490, 493 [NASA ADS] [CrossRef] [Google Scholar]
- Newman, A. B., Treu, T., Ellis, R. S., et al. 2013, ApJ, 765, 24 [NASA ADS] [CrossRef] [Google Scholar]
- Paz, D. J., Lambas, D. G., Padilla, N., & Merchán, M. 2006, MNRAS, 366, 1503 [NASA ADS] [CrossRef] [Google Scholar]
- Paz, D. J., Sgró, M. A., Merchán, M., & Padilla, N. 2011, MNRAS, 414, 2029 [NASA ADS] [CrossRef] [Google Scholar]
- Plionis, M., Barrow, J. D., & Frenk, C. S. 1991, MNRAS, 249, 662 [NASA ADS] [CrossRef] [Google Scholar]
- Plionis, M., Basilakos, S., & Ragone-Figueroa, C. 2006, ApJ, 650, 770 [NASA ADS] [CrossRef] [Google Scholar]
- Popesso, P., Biviano, A., Böhringer, H., Romaniello, M., & Voges, W. 2005, A&A, 433, 431 [NASA ADS] [CrossRef] [EDP Sciences] [Google Scholar]
- Prada, F., Klypin, A. A., Cuesta, A. J., Betancort-Rijo, J. E., & Primack, J. 2012, MNRAS, 423, 3018 [NASA ADS] [CrossRef] [Google Scholar]
- Ragone-Figueroa, C., Plionis, M., Merchán, M., Gottlöber, S., & Yepes, G. 2010, MNRAS, 407, 581 [NASA ADS] [CrossRef] [Google Scholar]
- Rapetti, D., Blake, C., Allen, S. W., et al. 2013, MNRAS, 432, 973 [NASA ADS] [CrossRef] [Google Scholar]
- Rozo, E., Wechsler, R. H., Rykoff, E. S., et al. 2010, ApJ, 708, 645 [NASA ADS] [CrossRef] [Google Scholar]
- Sereno, M., De Filippis, E., Longo, G., & Bautz, M. W. 2006, ApJ, 645, 170 [NASA ADS] [CrossRef] [Google Scholar]
- Sereno, M., Ettori, S., Umetsu, K., & Baldi, A. 2013, MNRAS, 428, 2241 [NASA ADS] [CrossRef] [Google Scholar]
- Smith, G. P., Khosroshahi, H. G., Dariush, A., et al. 2010, MNRAS, 409, 169 [NASA ADS] [CrossRef] [Google Scholar]
- Tovmassian, H. M., & Plionis, M. 2009, ApJ, 696, 1441 [NASA ADS] [CrossRef] [Google Scholar]
- van den Bosch, F. C., Aquino, D., Yang, X., et al. 2008, MNRAS, 387, 79 [Google Scholar]
- Vikhlinin, A., Kravtsov, A., Forman, W., et al. 2006, ApJ, 640, 691 [NASA ADS] [CrossRef] [Google Scholar]
- Wang, Y., Yang, X., Mo, H. J., et al. 2008, MNRAS, 385, 1511 [NASA ADS] [CrossRef] [Google Scholar]
- Wojtak, R., & Łokas, E. L. 2010, MNRAS, 408, 2442 [NASA ADS] [CrossRef] [Google Scholar]
- Wojtak, R., Łokas, E. L., Mamon, G. A., et al. 2007, A&A, 466, 437 [NASA ADS] [CrossRef] [EDP Sciences] [Google Scholar]
- Wojtak, R., Hansen, S. H., & Hjorth, J. 2011, Nature, 477, 567 [NASA ADS] [CrossRef] [Google Scholar]
- Wojtak, R., Gottlöber, S., & Klypin, A. 2013, MNRAS, 434, 1576 [NASA ADS] [CrossRef] [Google Scholar]
- Yang, X., Mo, H. J., van den Bosch, F. C., et al. 2007, ApJ, 671, 153 [NASA ADS] [CrossRef] [Google Scholar]
All Figures
|
Fig. 1 Line of sight velocity dispersion in 574 clusters and rich groups of galaxies as a function of the apparent elongation q2D. The blue error bars show the mean 68 per cent uncertainties of the measurements. The black points show the mean and the 68 per cent scatter of the dispersions in 5 bins of the elongation. The velocity dispersions are scaled by the characteristic velocity Vc which is a measure of the gravitational potential depth of the host dark matter haloes. The figure shows that circular clusters exhibit higher normalised line of sight velocity dispersions than elongated ones. |
| In the text | |
|
Fig. 2 Coefficients of a linear relation between the normalised line of sight velocity dispersion, σlos/Vc, and the apparent elongation, q2D, of the clusters. The shaded regions show the 68 and 95 per cent confidence contours of the posterior probability distribution marginalised over the intrinsic scatter in σlos/Vc. A positive slope signifies a correlation between the normalised line of sight velocity dispersion and the apparent elongation, consistent with prolate cluster shapes both in 3D position and 3D velocity space. |
| In the text | |
|
Fig. 3 Effect of dynamical state of clusters on the coefficients of a linear relation between the normalised line of sight velocity dispersion, σlos/Vc, and the apparent elongation, q2D, inferred from the galaxy distribution on the sky. The red contours, with (σlos/Vc)(q2D = 0.7) ≳ 0.625, show constraints for dynamically old clusters and the blue ones, with (σlos/Vc)(q2D = 0.7) ≲ 0.625, for dynamically young. The filled and empty contours correspond to the clusters selected by the fraction of red galaxies and by the magnitude gap of the two brightest galaxies, respectively. The contours show the 68 and 95 per cent confidence regions of the posterior probability distribution marginalised over the intrinsic scatter in σlos/Vc. Clusters at different dynamical states exhibit consistently a correlation between the normalised line of sight dispersion and the apparent elongation. |
| In the text | |
|
Fig. 4 Mean, μq3D, and dispersion, σq3D, of the axial ratios of prolate ellipsoids approximating the 3D shapes of galaxy clusters. The contours show the 68 and 95 per cent confidence regions of the posterior probability. |
| In the text | |
|
Fig. 5 Position of the maximum, μq3D, and dispersion, σq3D, of a Gaussian approximating the distribution of the axial ratios qv = σmin/σmaj of prolate velocity ellipsoids representing the velocity dispersion tensor. The contours show the 68 and 95 per cent confidence regions of the posterior probability distribution marginalised over the bias parameter |
| In the text | |
|
Fig. 6 Bias parameter, |
| In the text | |
|
Fig. 7 Bias parameter |
| In the text | |
Current usage metrics show cumulative count of Article Views (full-text article views including HTML views, PDF and ePub downloads, according to the available data) and Abstracts Views on Vision4Press platform.
Data correspond to usage on the plateform after 2015. The current usage metrics is available 48-96 hours after online publication and is updated daily on week days.
Initial download of the metrics may take a while.